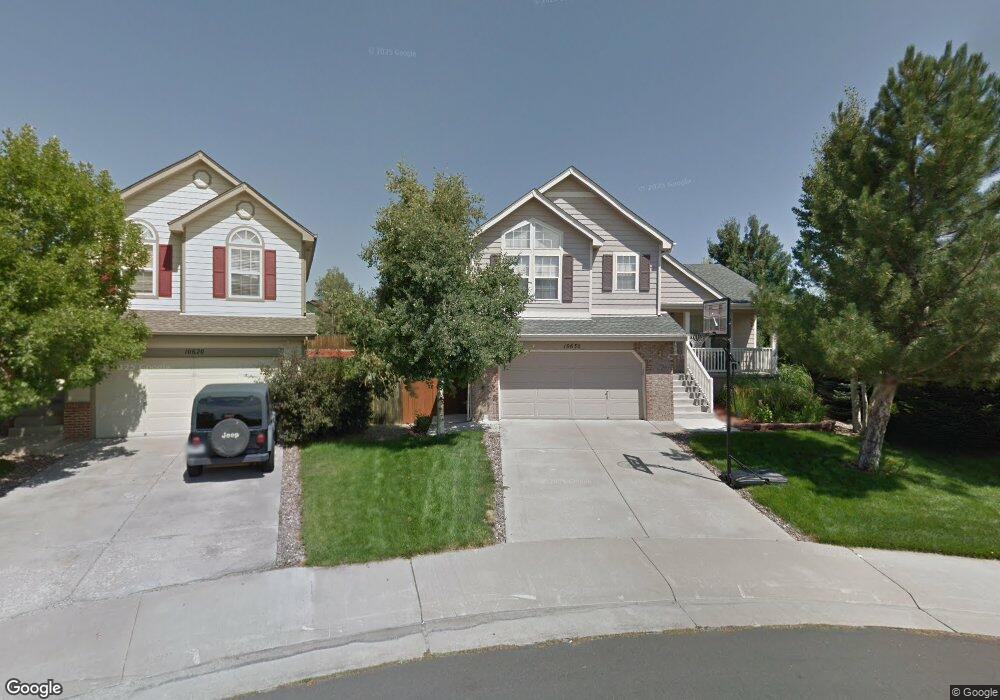
10630 Pommel Ct Parker, CO 80134
Bradbury Ranch NeighborhoodEstimated Value: $573,974 - $610,000
3
Beds
3
Baths
1,751
Sq Ft
$341/Sq Ft
Est. Value
About This Home
This home is located at 10630 Pommel Ct, Parker, CO 80134 and is currently estimated at $597,244, approximately $341 per square foot. 10630 Pommel Ct is a home located in Douglas County with nearby schools including Prairie Crossing Elementary School, Sierra Middle School, and Chaparral High School.
Ownership History
Date
Name
Owned For
Owner Type
Purchase Details
Closed on
Jun 10, 2005
Sold by
Feghali Habib
Bought by
Feghali Habib T and Feghali Nathalie H
Current Estimated Value
Home Financials for this Owner
Home Financials are based on the most recent Mortgage that was taken out on this home.
Original Mortgage
$256,338
Outstanding Balance
$133,824
Interest Rate
5.76%
Mortgage Type
FHA
Estimated Equity
$463,420
Purchase Details
Closed on
Apr 12, 2000
Sold by
Stubbings Troy W and Stubbings Renee L
Bought by
Adams Becky L and Howe John A
Home Financials for this Owner
Home Financials are based on the most recent Mortgage that was taken out on this home.
Original Mortgage
$194,750
Interest Rate
7.87%
Purchase Details
Closed on
Aug 30, 1996
Sold by
Amrepco Inc
Bought by
Stubbings Troy W and Stubbings Renee L
Home Financials for this Owner
Home Financials are based on the most recent Mortgage that was taken out on this home.
Original Mortgage
$150,716
Interest Rate
8.24%
Mortgage Type
FHA
Create a Home Valuation Report for This Property
The Home Valuation Report is an in-depth analysis detailing your home's value as well as a comparison with similar homes in the area
Home Values in the Area
Average Home Value in this Area
Purchase History
| Date | Buyer | Sale Price | Title Company |
|---|---|---|---|
| Feghali Habib T | -- | -- | |
| Feghali Habib | $260,000 | -- | |
| Adams Becky L | $205,000 | -- | |
| Stubbings Troy W | $154,113 | North American Title |
Source: Public Records
Mortgage History
| Date | Status | Borrower | Loan Amount |
|---|---|---|---|
| Open | Feghali Habib | $256,338 | |
| Previous Owner | Adams Becky L | $194,750 | |
| Previous Owner | Stubbings Troy W | $150,716 |
Source: Public Records
Tax History Compared to Growth
Tax History
| Year | Tax Paid | Tax Assessment Tax Assessment Total Assessment is a certain percentage of the fair market value that is determined by local assessors to be the total taxable value of land and additions on the property. | Land | Improvement |
|---|---|---|---|---|
| 2024 | $3,524 | $44,030 | $9,380 | $34,650 |
| 2023 | $3,566 | $44,030 | $9,380 | $34,650 |
| 2022 | $2,608 | $30,160 | $6,370 | $23,790 |
| 2021 | $2,715 | $30,160 | $6,370 | $23,790 |
| 2020 | $2,689 | $30,380 | $7,820 | $22,560 |
| 2019 | $2,706 | $30,380 | $7,820 | $22,560 |
| 2018 | $2,375 | $25,990 | $7,050 | $18,940 |
| 2017 | $2,204 | $25,990 | $7,050 | $18,940 |
| 2016 | $2,057 | $23,810 | $5,770 | $18,040 |
| 2015 | $2,094 | $23,810 | $5,770 | $18,040 |
| 2014 | $1,934 | $19,600 | $5,770 | $13,830 |
Source: Public Records
Map
Nearby Homes
- 10818 Mcclellan Rd
- 16641 Martingale Dr
- 16116 Martingale Dr
- 10858 Willow Reed Cir E
- 10828 Snowdon St
- 10834 Snowdon St
- 16135 Peregrine Dr
- 11029 Grouse Ct
- 11613 Masonville Dr
- 10832 Tundra Top Dr
- 10896 Snowdon St
- 11626 Masonville Dr
- 10849 Tundra Top Dr
- 10553 Stonemeadow Dr
- 10873 Tundra Top Dr
- 15902 Stringhalt Way
- 15733 Mccauley Dr
- 10414 Stonewillow Dr
- 16181 White Hawk Dr
- 17109 Campion Way
- 10640 Pommel Ct
- 10620 Pommel Ct
- 10660 Pommel Ct
- 10615 Pommel Ct
- 16278 Laurelhill Ct
- 16294 Laurelhill Ct
- 16346 Oakmoor Place
- 10625 Pommel Ct
- 16262 Laurelhill Ct
- 10680 Pommel Ct
- 10665 Pommel Ct
- 10723 Appaloosa Ct
- 10725 Appaloosa Ct
- 10635 Pommel Ct
- 10645 Pommel Ct
- 16246 Laurelhill Ct
- 10685 Pommel Ct
- 10700 Pommel Ct
- 16378 Oakmoor Place
- 10719 Appaloosa Ct