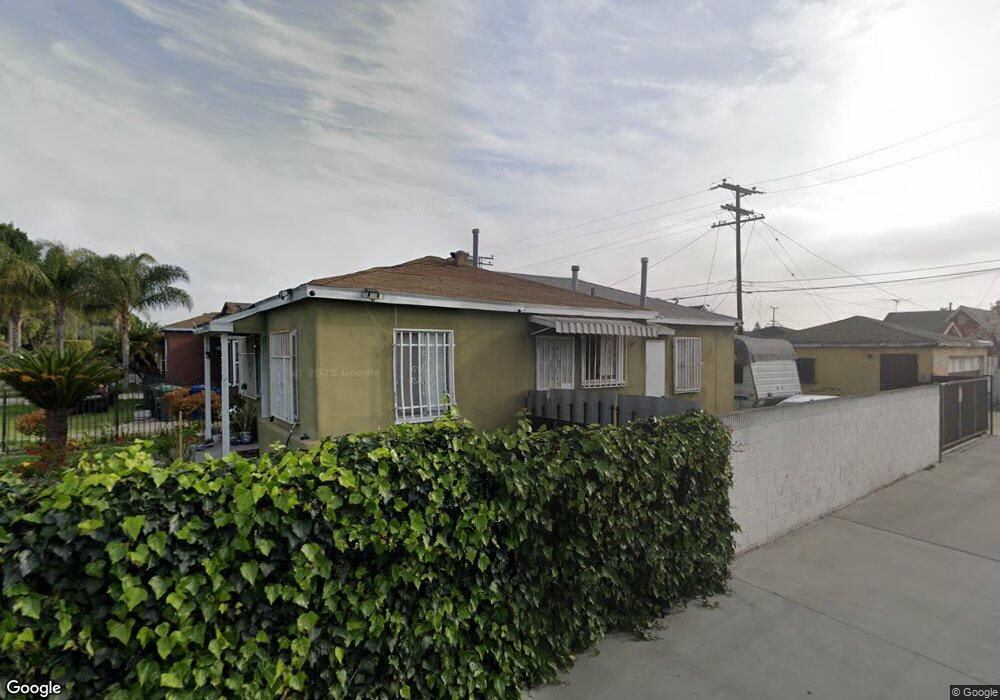
10630 San Anselmo Ave South Gate, CA 90280
Estimated Value: $388,000 - $658,000
2
Beds
1
Bath
796
Sq Ft
$656/Sq Ft
Est. Value
About This Home
This home is located at 10630 San Anselmo Ave, South Gate, CA 90280 and is currently estimated at $522,451, approximately $656 per square foot. 10630 San Anselmo Ave is a home located in Los Angeles County with nearby schools including Montara Avenue Elementary School, Southeast Middle School, and South Gate Middle School.
Ownership History
Date
Name
Owned For
Owner Type
Purchase Details
Closed on
Jun 2, 2023
Sold by
Domingo Sulieto and Arteaga Diana K
Bought by
Arteaga Diana K
Current Estimated Value
Home Financials for this Owner
Home Financials are based on the most recent Mortgage that was taken out on this home.
Original Mortgage
$142,500
Interest Rate
6.71%
Mortgage Type
New Conventional
Purchase Details
Closed on
May 19, 1997
Sold by
Sanchez Roberto and Sanchez Irma
Bought by
Arteaga Dario
Home Financials for this Owner
Home Financials are based on the most recent Mortgage that was taken out on this home.
Original Mortgage
$119,000
Interest Rate
4.95%
Purchase Details
Closed on
Nov 1, 1996
Sold by
Federal National Mortgage Association
Bought by
Sanchez Roberto and Sanchez Irma
Purchase Details
Closed on
Apr 12, 1996
Sold by
Norwest Mtg Inc
Bought by
Federal National Mortgage Association
Purchase Details
Closed on
Mar 21, 1996
Sold by
Vasquez Carlos E
Bought by
New Haven Corp
Create a Home Valuation Report for This Property
The Home Valuation Report is an in-depth analysis detailing your home's value as well as a comparison with similar homes in the area
Home Values in the Area
Average Home Value in this Area
Purchase History
| Date | Buyer | Sale Price | Title Company |
|---|---|---|---|
| Arteaga Diana K | -- | None Listed On Document | |
| Arteaga Dario | $271,500 | None Listed On Document | |
| Arteaga Dario | $140,000 | Stewart Title | |
| Sanchez Roberto | $90,000 | Stewart Title | |
| Federal National Mortgage Association | -- | -- | |
| New Haven Corp | -- | -- |
Source: Public Records
Mortgage History
| Date | Status | Borrower | Loan Amount |
|---|---|---|---|
| Previous Owner | Arteaga Dario | $142,500 | |
| Previous Owner | Arteaga Dario | $119,000 | |
| Closed | Arteaga Dario | $7,000 |
Source: Public Records
Tax History Compared to Growth
Tax History
| Year | Tax Paid | Tax Assessment Tax Assessment Total Assessment is a certain percentage of the fair market value that is determined by local assessors to be the total taxable value of land and additions on the property. | Land | Improvement |
|---|---|---|---|---|
| 2025 | $5,188 | $394,479 | $288,394 | $106,085 |
| 2024 | $5,188 | $386,745 | $282,740 | $104,005 |
| 2023 | $3,115 | $219,135 | $123,031 | $96,104 |
| 2022 | $2,974 | $214,839 | $120,619 | $94,220 |
| 2021 | $2,938 | $210,627 | $118,254 | $92,373 |
| 2019 | $2,847 | $204,382 | $114,748 | $89,634 |
| 2018 | $2,723 | $200,376 | $112,499 | $87,877 |
| 2016 | $2,598 | $192,597 | $108,132 | $84,465 |
| 2015 | $2,556 | $189,705 | $106,508 | $83,197 |
| 2014 | $2,557 | $185,990 | $104,422 | $81,568 |
Source: Public Records
Map
Nearby Homes
- 2714 E 109th St
- 10430 San Jose Ave
- 2649 111th St
- 3220 Tecumseh Ave
- 10355 Long Beach Blvd
- 10303 Long Beach Blvd
- 11141 Franklin St
- 10719 Mona Blvd
- 3171 Norton Ave
- 10752 Weigand Ave
- 2554 Santa Ana Blvd S
- 2459 E 111th St
- 2461 Santa Ana Blvd N
- 3034 Nebraska Ave
- 10868 Weigand Ave
- 2432 E 112th Place
- 3358 Michigan Ave
- 2975 Fernwood Ave
- 3364 Elizabeth Ave
- 2600 Nebraska Ave
- 10624 San Anselmo Ave
- 10618 San Anselmo Ave
- 10641 Montara Ave
- 10625 Montara Ave
- 10612 San Anselmo Ave
- 10619 Montara Ave
- 10606 San Anselmo Ave
- 10631 San Anselmo Ave
- 2973 Century Blvd
- 10613 Montara Ave
- 10625 San Anselmo Ave
- 10619 San Anselmo Ave
- 10607 Montara Ave
- 10600 San Anselmo Ave
- 10613 San Anselmo Ave
- 2923 Century Blvd
- 10607 San Anselmo Ave
- 10601 Montara Ave
- 10538 San Anselmo Ave
- 10601 San Anselmo Ave