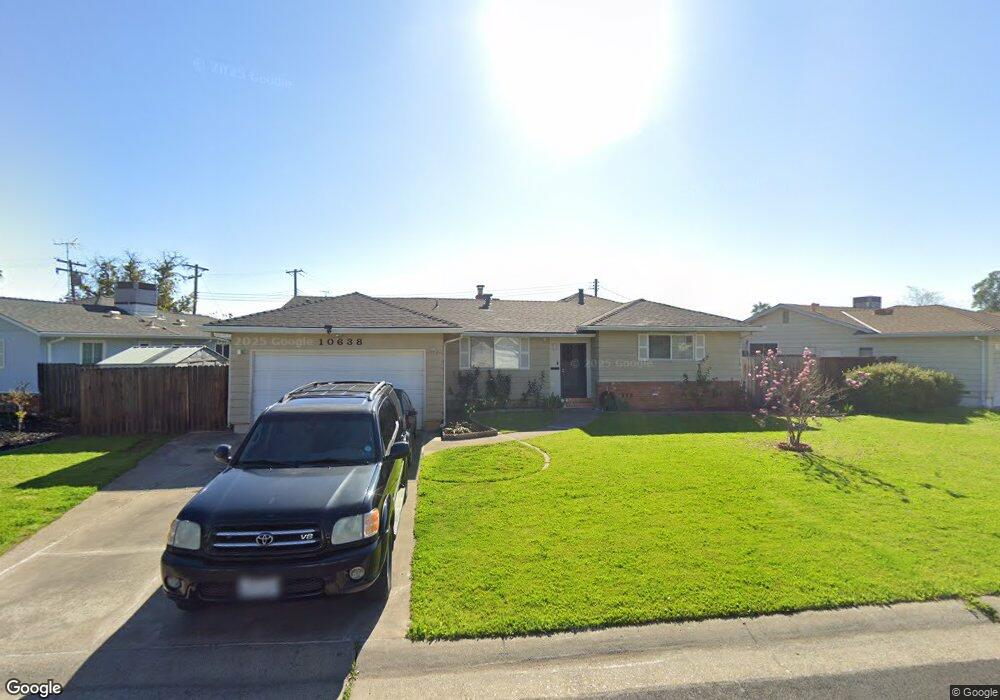
10638 Pedro Way Rancho Cordova, CA 95670
Cordova Vineyards NeighborhoodEstimated Value: $435,000 - $450,000
3
Beds
2
Baths
1,538
Sq Ft
$288/Sq Ft
Est. Value
About This Home
This home is located at 10638 Pedro Way, Rancho Cordova, CA 95670 and is currently estimated at $443,071, approximately $288 per square foot. 10638 Pedro Way is a home located in Sacramento County with nearby schools including Rancho Cordova Elementary School, Mills Middle School, and Cordova High School.
Ownership History
Date
Name
Owned For
Owner Type
Purchase Details
Closed on
Nov 1, 2017
Sold by
Dam Phi
Bought by
Dam Phi and Dam Dinh T
Current Estimated Value
Home Financials for this Owner
Home Financials are based on the most recent Mortgage that was taken out on this home.
Original Mortgage
$135,000
Outstanding Balance
$113,064
Interest Rate
3.83%
Mortgage Type
New Conventional
Estimated Equity
$330,007
Purchase Details
Closed on
Jun 10, 1998
Sold by
Dam Phi & Dinh Toi and Dinh T
Bought by
Dam Phi and Dam Dinh T
Home Financials for this Owner
Home Financials are based on the most recent Mortgage that was taken out on this home.
Original Mortgage
$86,000
Interest Rate
7.11%
Purchase Details
Closed on
Jul 13, 1995
Sold by
Mckee John M and Mckee Joanne B
Bought by
Dam Phi and Dam Dinh Toi
Home Financials for this Owner
Home Financials are based on the most recent Mortgage that was taken out on this home.
Original Mortgage
$84,000
Interest Rate
7.59%
Create a Home Valuation Report for This Property
The Home Valuation Report is an in-depth analysis detailing your home's value as well as a comparison with similar homes in the area
Home Values in the Area
Average Home Value in this Area
Purchase History
| Date | Buyer | Sale Price | Title Company |
|---|---|---|---|
| Dam Phi | -- | Old Republic Title Company | |
| Dam Phi | -- | Old Republic Title Company | |
| Dam Phi | -- | Sacramento Title Company | |
| Dam Phi | $105,000 | Placer Title Company |
Source: Public Records
Mortgage History
| Date | Status | Borrower | Loan Amount |
|---|---|---|---|
| Open | Dam Phi | $135,000 | |
| Closed | Dam Phi | $86,000 | |
| Closed | Dam Phi | $84,000 |
Source: Public Records
Tax History Compared to Growth
Tax History
| Year | Tax Paid | Tax Assessment Tax Assessment Total Assessment is a certain percentage of the fair market value that is determined by local assessors to be the total taxable value of land and additions on the property. | Land | Improvement |
|---|---|---|---|---|
| 2025 | $2,019 | $174,402 | $78,728 | $95,674 |
| 2024 | $2,019 | $170,984 | $77,185 | $93,799 |
| 2023 | $1,977 | $167,632 | $75,672 | $91,960 |
| 2022 | $1,949 | $164,346 | $74,189 | $90,157 |
| 2021 | $1,909 | $161,125 | $72,735 | $88,390 |
| 2020 | $1,896 | $159,474 | $71,990 | $87,484 |
| 2019 | $1,864 | $156,348 | $70,579 | $85,769 |
| 2018 | $1,814 | $153,284 | $69,196 | $84,088 |
| 2017 | $1,767 | $150,280 | $67,840 | $82,440 |
| 2016 | $1,719 | $147,334 | $66,510 | $80,824 |
| 2015 | $1,631 | $145,121 | $65,511 | $79,610 |
| 2014 | $1,735 | $142,279 | $64,228 | $78,051 |
Source: Public Records
Map
Nearby Homes
- 2701 Zinfandel Dr
- 2746 Aramon Dr
- 10810 Paiute Way
- 2413 Cordova Ln
- 2724 Zinfandel Dr
- 2344 Rudat Cir
- 10825 Walnutwood Way
- 10583 Home Ranch Ct
- 2644 Tronero Way
- 2404 Coolidge Way
- 10361 Daniel Way
- 10470 Spaulding Way
- 2600 Garrett Way
- 10465 Rugby Ct
- 2266 River Trails Cir
- 2329 Mcgregor Dr
- 2129 Danbury Way
- 2352 Sonata Dr
- 2171 River Vista Way
- 2337 Benita Dr
- 10644 Pedro Way
- 10632 Pedro Way
- 10630 Chianti Ct
- 10637 Pedro Way
- 10650 Pedro Way
- 2638 Chassella Way
- 10641 Pedro Way
- 10628 Chianti Ct
- 10633 Pedro Way
- 10645 Pedro Way
- 2642 Chassella Way
- 10620 Pedro Way
- 10649 Pedro Way
- 10627 Pedro Way
- 2646 Chassella Way
- 10626 Chianti Ct
- 2620 Chassella Way
- 2615 Barbera Way
- 10621 Pedro Way
- 2619 Barbera Way