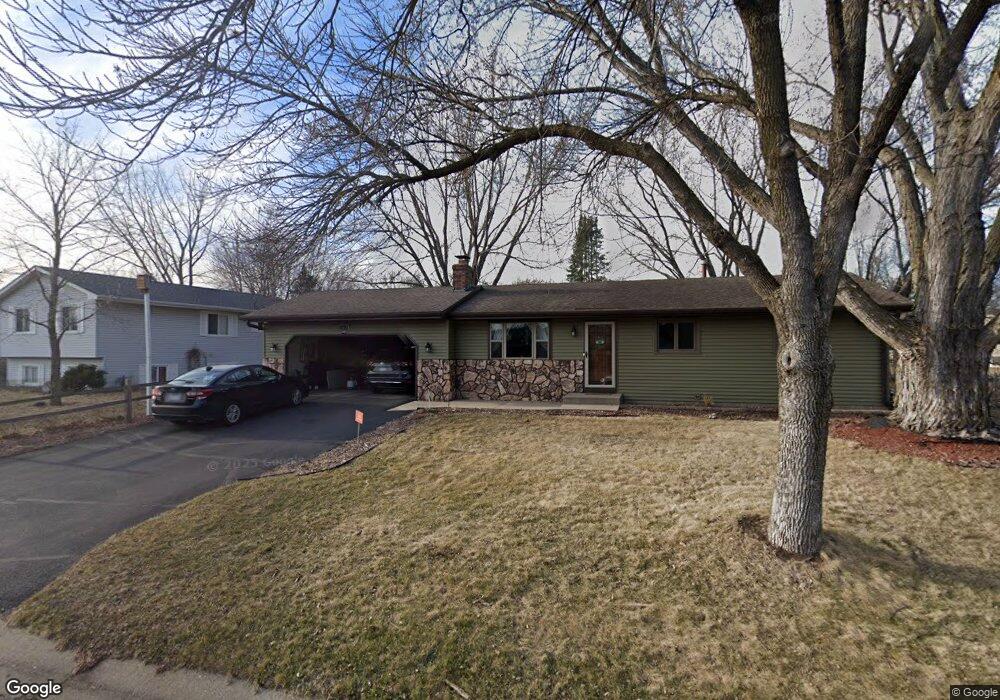
10640 99th Place N Maple Grove, MN 55369
Estimated Value: $383,000 - $397,000
3
Beds
2
Baths
1,935
Sq Ft
$201/Sq Ft
Est. Value
About This Home
This home is located at 10640 99th Place N, Maple Grove, MN 55369 and is currently estimated at $389,696, approximately $201 per square foot. 10640 99th Place N is a home located in Hennepin County with nearby schools including Elm Creek Elementary School, Osseo Middle School, and Osseo Senior High School.
Ownership History
Date
Name
Owned For
Owner Type
Purchase Details
Closed on
Aug 6, 2020
Sold by
Gust Anthony and Gust Kelsy M
Bought by
Welch Adam and Nelson Stephanie
Current Estimated Value
Home Financials for this Owner
Home Financials are based on the most recent Mortgage that was taken out on this home.
Original Mortgage
$286,615
Outstanding Balance
$257,525
Interest Rate
3.1%
Mortgage Type
New Conventional
Estimated Equity
$120,062
Purchase Details
Closed on
Aug 14, 2015
Sold by
Olson David and Olson Shyerl
Bought by
Gust Anthony and Gust Kelsy M
Home Financials for this Owner
Home Financials are based on the most recent Mortgage that was taken out on this home.
Original Mortgage
$117,000
Interest Rate
4.09%
Mortgage Type
New Conventional
Purchase Details
Closed on
Nov 18, 1996
Sold by
Hunter Larry L and Hunter Kristine D
Bought by
Olson David and Olson Sheryl
Create a Home Valuation Report for This Property
The Home Valuation Report is an in-depth analysis detailing your home's value as well as a comparison with similar homes in the area
Home Values in the Area
Average Home Value in this Area
Purchase History
| Date | Buyer | Sale Price | Title Company |
|---|---|---|---|
| Welch Adam | $301,700 | Title Specialists Inc | |
| Gust Anthony | $210,000 | Title Specialists Inc | |
| Olson David | $113,000 | -- |
Source: Public Records
Mortgage History
| Date | Status | Borrower | Loan Amount |
|---|---|---|---|
| Open | Welch Adam | $286,615 | |
| Previous Owner | Gust Anthony | $71,307 | |
| Previous Owner | Gust Anthony | $117,000 | |
| Previous Owner | Olson David | $99,500 |
Source: Public Records
Tax History Compared to Growth
Tax History
| Year | Tax Paid | Tax Assessment Tax Assessment Total Assessment is a certain percentage of the fair market value that is determined by local assessors to be the total taxable value of land and additions on the property. | Land | Improvement |
|---|---|---|---|---|
| 2023 | $4,169 | $359,300 | $119,600 | $239,700 |
| 2022 | $3,325 | $343,900 | $94,600 | $249,300 |
| 2021 | $3,159 | $278,900 | $68,300 | $210,600 |
| 2020 | $2,886 | $261,500 | $54,300 | $207,200 |
| 2019 | $2,942 | $235,000 | $51,000 | $184,000 |
| 2018 | $2,748 | $227,100 | $50,000 | $177,100 |
| 2017 | $2,493 | $186,800 | $40,000 | $146,800 |
| 2016 | $2,564 | $189,000 | $45,000 | $144,000 |
| 2015 | $2,616 | $187,700 | $47,000 | $140,700 |
| 2014 | -- | $175,500 | $44,500 | $131,000 |
Source: Public Records
Map
Nearby Homes
- 10740 99th Place N
- 10215 Union Terrace Ln N
- 9880 Cottonwood Ln N
- 9895 98th Place N
- 10000 Nathan Ln N
- 10315 Boundary Creek Terrace
- 10047 Pilgrim Way
- 6866 Zachary Ln N
- 10436 Yorktown Ln N
- 14927 106th Ave N
- 10162 93rd Ave N
- 9995 106th Place N
- 12220 101st Ave N
- 10666 107th Place N
- 10544 Lancaster Ln N
- 613 1st Ave NW
- 9451 Kirkwood Way N
- 12055 93rd Place N
- 10890 108th Place N
- 9311 Kirkwood Ln N
- 10680 99th Place N
- 10600 99th Place N
- 10631 100th Ave N
- 10661 100th Ave N
- 9985 Union Terrace Ln N
- 10605 99th Place N
- 10645 99th Place N
- 9995 Union Terrace Ln N
- 10691 100th Ave N
- 10585 99th Place N
- 10685 99th Place N
- 10565 99th Place N
- 10731 100th Ave N
- 10705 99th Place N
- 10005 Union Terrace Ln N
- 9955 Union Terrace Ln N
- 10690 100th Ave N
- 9990 Union Terrace Ln N
- 10000 Union Terrace Ln N
- 10745 99th Place N