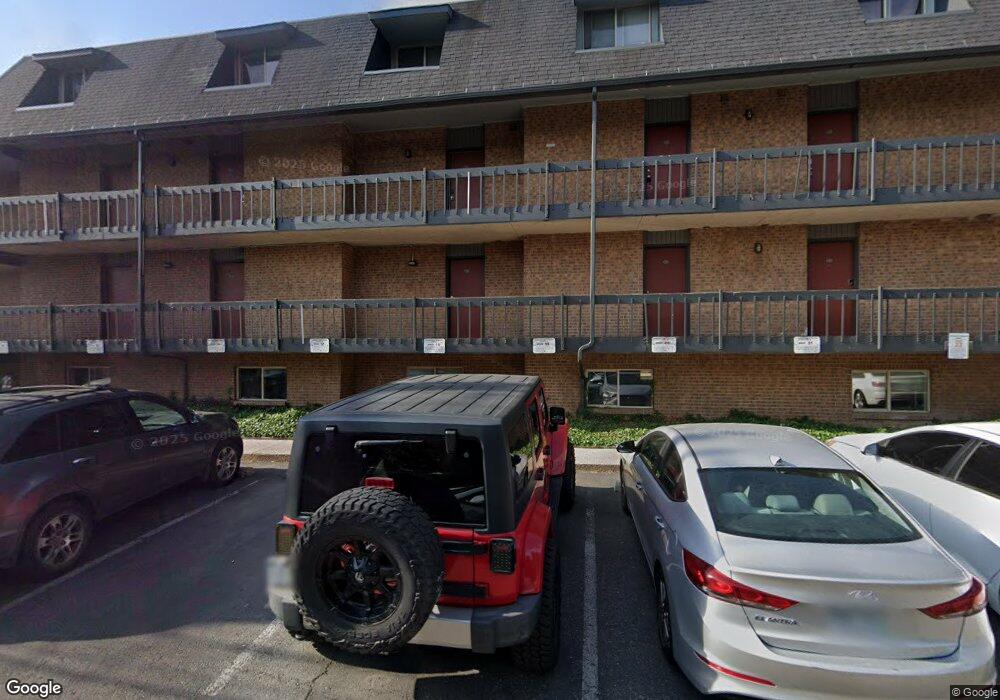
1065 University Ave Unit 211 Boulder, CO 80302
University Hill NeighborhoodEstimated Value: $678,829 - $750,000
2
Beds
2
Baths
992
Sq Ft
$726/Sq Ft
Est. Value
About This Home
This home is located at 1065 University Ave Unit 211, Boulder, CO 80302 and is currently estimated at $719,957, approximately $725 per square foot. 1065 University Ave Unit 211 is a home located in Boulder County with nearby schools including Flatirons Elementary School, Manhattan Middle School of the Arts & Academics, and Boulder High School.
Ownership History
Date
Name
Owned For
Owner Type
Purchase Details
Closed on
May 28, 1998
Sold by
Williams Matthew C
Bought by
Ohan Kary M
Current Estimated Value
Home Financials for this Owner
Home Financials are based on the most recent Mortgage that was taken out on this home.
Original Mortgage
$77,250
Outstanding Balance
$15,683
Interest Rate
7.22%
Estimated Equity
$704,274
Purchase Details
Closed on
May 14, 1998
Sold by
Bonney Jean
Bought by
Williams Matthew C
Home Financials for this Owner
Home Financials are based on the most recent Mortgage that was taken out on this home.
Original Mortgage
$77,250
Outstanding Balance
$15,683
Interest Rate
7.22%
Estimated Equity
$704,274
Purchase Details
Closed on
Jun 30, 1994
Sold by
Zielinski Frank M and Zielinski Doris E
Bought by
Williams Matthew C
Home Financials for this Owner
Home Financials are based on the most recent Mortgage that was taken out on this home.
Original Mortgage
$88,400
Interest Rate
8.46%
Mortgage Type
FHA
Purchase Details
Closed on
Oct 14, 1986
Bought by
Ohan Kary M
Create a Home Valuation Report for This Property
The Home Valuation Report is an in-depth analysis detailing your home's value as well as a comparison with similar homes in the area
Home Values in the Area
Average Home Value in this Area
Purchase History
| Date | Buyer | Sale Price | Title Company |
|---|---|---|---|
| Ohan Kary M | $103,000 | -- | |
| Williams Matthew C | -- | -- | |
| Williams Matthew C | -- | -- | |
| Williams Matthew C | $91,000 | -- | |
| Ohan Kary M | $76,900 | -- |
Source: Public Records
Mortgage History
| Date | Status | Borrower | Loan Amount |
|---|---|---|---|
| Open | Ohan Kary M | $77,250 | |
| Previous Owner | Williams Matthew C | $88,400 |
Source: Public Records
Tax History
| Year | Tax Paid | Tax Assessment Tax Assessment Total Assessment is a certain percentage of the fair market value that is determined by local assessors to be the total taxable value of land and additions on the property. | Land | Improvement |
|---|---|---|---|---|
| 2025 | $3,209 | $40,744 | -- | $40,744 |
| 2024 | $3,209 | $40,744 | -- | $40,744 |
| 2023 | $3,151 | $35,616 | -- | $39,301 |
| 2022 | $3,187 | $33,506 | $0 | $33,506 |
| 2021 | $3,042 | $34,470 | $0 | $34,470 |
| 2020 | $2,968 | $34,098 | $0 | $34,098 |
| 2019 | $2,923 | $34,098 | $0 | $34,098 |
| 2018 | $2,303 | $26,561 | $0 | $26,561 |
| 2017 | $2,231 | $29,364 | $0 | $29,364 |
| 2016 | $2,257 | $26,069 | $0 | $26,069 |
| 2015 | $2,137 | $22,662 | $0 | $22,662 |
| 2014 | $1,948 | $22,662 | $0 | $22,662 |
Source: Public Records
Map
Nearby Homes
- 1065 University Ave Unit 105
- 1405 Broadway St Unit 206
- 1405 Broadway St Unit 102
- 920 University Ave
- 1128 Lincoln Place
- 944 Arapahoe Ave Unit A
- 944 Arapahoe Ave Unit B
- 735 University Ave
- 1200 College Ave Unit 118
- 1084 Grant Place
- 1077 Canyon Blvd Unit 304
- 1077 Canyon Blvd Unit 403
- 1077 Canyon Blvd Unit 305
- 1077 Canyon Blvd Unit 211
- 715 Arapahoe Ave Unit 2
- 1021 9th St
- 1155 Canyon Blvd Unit 202
- 1155 Canyon Blvd Unit 205
- 780 College Ave
- 1715 15th St Unit 4
- 1065 University Ave
- 1065 University Ave Unit 224
- 1065 University Ave Unit 223
- 1065 University Ave Unit 222
- 1065 University Ave Unit 221
- 1065 University Ave Unit 220
- 1065 University Ave Unit 219
- 1065 University Ave Unit 218
- 1065 University Ave Unit 217
- 1065 University Ave Unit 216
- 1065 University Ave Unit 215
- 1065 University Ave Unit 214
- 1065 University Ave Unit 213
- 1065 University Ave Unit 212
- 1065 University Ave Unit 210
- 1065 University Ave Unit 209
- 1065 University Ave Unit 208
- 1065 University Ave Unit 207
- 1065 University Ave Unit 206
- 1065 University Ave Unit 205
Your Personal Tour Guide
Ask me questions while you tour the home.