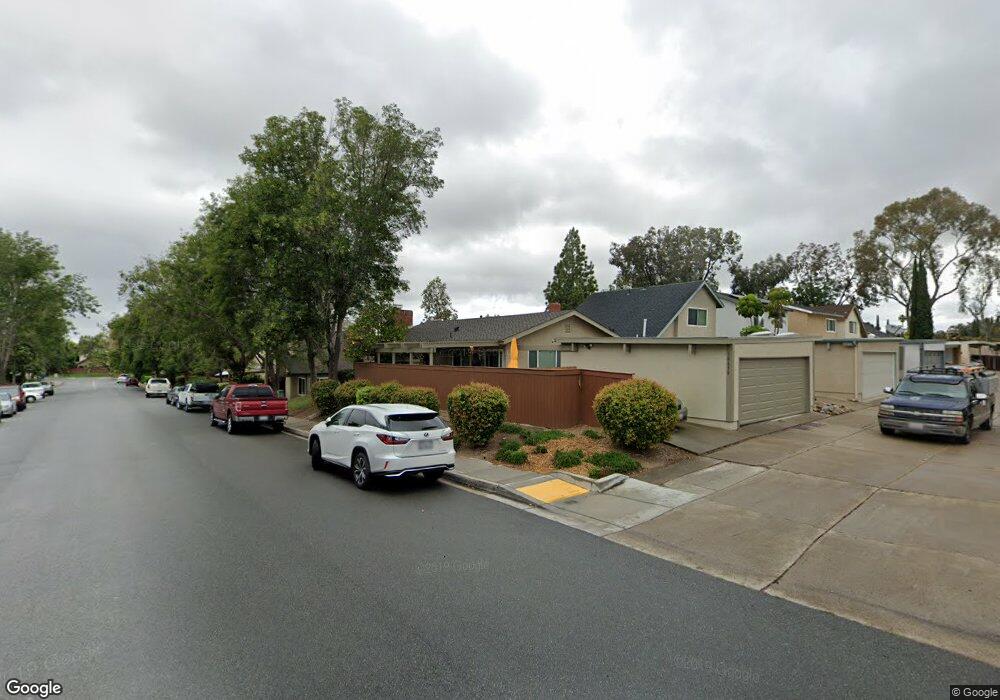
10650 Esmeraldas Dr San Diego, CA 92124
Tierrasanta NeighborhoodEstimated Value: $780,500 - $925,000
2
Beds
2
Baths
1,050
Sq Ft
$820/Sq Ft
Est. Value
About This Home
This home is located at 10650 Esmeraldas Dr, San Diego, CA 92124 and is currently estimated at $860,875, approximately $819 per square foot. 10650 Esmeraldas Dr is a home located in San Diego County with nearby schools including Tierrasanta Elementary, De Portola Middle School, and Farb Middle School.
Ownership History
Date
Name
Owned For
Owner Type
Purchase Details
Closed on
Jul 16, 2013
Sold by
Biberacher Peter R and Biberacher Nancy R
Bought by
Biberacher Investments Lp
Current Estimated Value
Purchase Details
Closed on
May 17, 2013
Sold by
Biberacher Peter R and Biberacher Nancy R
Bought by
Biberacher Investments Lp
Home Financials for this Owner
Home Financials are based on the most recent Mortgage that was taken out on this home.
Original Mortgage
$191,000
Outstanding Balance
$134,673
Interest Rate
3.37%
Mortgage Type
New Conventional
Estimated Equity
$726,202
Purchase Details
Closed on
May 13, 2013
Sold by
Biberacher Investments Lp
Bought by
Biberacher Peter R and Biberacher Nancy R
Home Financials for this Owner
Home Financials are based on the most recent Mortgage that was taken out on this home.
Original Mortgage
$191,000
Outstanding Balance
$134,673
Interest Rate
3.37%
Mortgage Type
New Conventional
Estimated Equity
$726,202
Purchase Details
Closed on
Mar 24, 2005
Sold by
Biberacher Peter R and Biberacher Nancy R
Bought by
Biberacher Investments Lp
Purchase Details
Closed on
May 12, 2003
Sold by
Biberacher Peter R and Biberacher Nancy R
Bought by
Biberacher Peter R and Biberacher Nancy R
Home Financials for this Owner
Home Financials are based on the most recent Mortgage that was taken out on this home.
Original Mortgage
$228,000
Interest Rate
5.75%
Mortgage Type
Purchase Money Mortgage
Purchase Details
Closed on
Apr 6, 2001
Sold by
Biberacher Peter R and Biberacher Nancy R
Bought by
Biberacher Peter R and Biberacher Nancy R
Home Financials for this Owner
Home Financials are based on the most recent Mortgage that was taken out on this home.
Original Mortgage
$165,000
Interest Rate
7.06%
Purchase Details
Closed on
Mar 23, 2001
Sold by
Biberacher Peter R and Biberacher Nancy R
Bought by
Biberacher Peter R and Biberacher Nancy R
Home Financials for this Owner
Home Financials are based on the most recent Mortgage that was taken out on this home.
Original Mortgage
$165,000
Interest Rate
7.06%
Purchase Details
Closed on
Jul 19, 2000
Sold by
Biberacher Peter R and Biberacher Nancy R
Bought by
Biberacher Peter R and Biberacher Nancy R
Purchase Details
Closed on
Nov 30, 1999
Sold by
Dulfon Colette L Trust and Lee Colette
Bought by
Biberacher Peter R and Biberacher Nancy R
Home Financials for this Owner
Home Financials are based on the most recent Mortgage that was taken out on this home.
Original Mortgage
$124,000
Interest Rate
5.35%
Create a Home Valuation Report for This Property
The Home Valuation Report is an in-depth analysis detailing your home's value as well as a comparison with similar homes in the area
Home Values in the Area
Average Home Value in this Area
Purchase History
| Date | Buyer | Sale Price | Title Company |
|---|---|---|---|
| Biberacher Investments Lp | -- | Service Link | |
| Biberacher Investments Lp | -- | None Available | |
| Biberacher Peter R | -- | Servicelink | |
| Biberacher Investments Lp | -- | -- | |
| Biberacher Peter R | -- | Commonwealth Land Title Co | |
| Biberacher Peter R | -- | Commonwealth Land Title Co | |
| Biberacher Peter R | -- | Commonwealth Land Title Co | |
| Biberacher Peter R | -- | Commonwealth Land Title Co | |
| Biberacher Peter R | -- | -- | |
| Biberacher Peter R | $155,000 | Commonwealth Land Title Co |
Source: Public Records
Mortgage History
| Date | Status | Borrower | Loan Amount |
|---|---|---|---|
| Open | Biberacher Peter R | $191,000 | |
| Previous Owner | Biberacher Peter R | $228,000 | |
| Previous Owner | Biberacher Peter R | $165,000 | |
| Previous Owner | Biberacher Peter R | $124,000 |
Source: Public Records
Tax History Compared to Growth
Tax History
| Year | Tax Paid | Tax Assessment Tax Assessment Total Assessment is a certain percentage of the fair market value that is determined by local assessors to be the total taxable value of land and additions on the property. | Land | Improvement |
|---|---|---|---|---|
| 2025 | $3,004 | $238,211 | $107,577 | $130,634 |
| 2024 | $3,004 | $233,541 | $105,468 | $128,073 |
| 2023 | $2,934 | $228,962 | $103,400 | $125,562 |
| 2022 | $2,853 | $224,473 | $101,373 | $123,100 |
| 2021 | $2,829 | $220,073 | $99,386 | $120,687 |
| 2020 | $2,794 | $217,817 | $98,367 | $119,450 |
| 2019 | $2,745 | $213,547 | $96,439 | $117,108 |
| 2018 | $2,570 | $209,361 | $94,549 | $114,812 |
| 2017 | $2,508 | $205,257 | $92,696 | $112,561 |
| 2016 | $2,467 | $201,233 | $90,879 | $110,354 |
| 2015 | $2,430 | $198,211 | $89,514 | $108,697 |
| 2014 | $2,393 | $194,329 | $87,761 | $106,568 |
Source: Public Records
Map
Nearby Homes
- 10690 Esmeraldas Dr
- 10706 Esmeraldas Dr Unit 6
- 10748 Escobar Dr
- 10828 Lamentin Ct Unit 313
- 10812 Lamentin Ct Unit 312
- 5137 Abuela Dr
- 6140 Calle Mariselda Unit 102
- 10889 Lamentin Ct
- 10834 Caravelle Place
- 10945 Clairemont Mesa Blvd
- 10437 Hermanos Rd
- 5450 Rebolla Ln
- 5059 La Cuenta Dr
- 5449 Escarchosa Ln
- 10852 Carbet Place
- 10140 Gayuba Ln
- 10165 Gayuba Ln Unit 311
- 6161 Calle Mariselda Unit 408
- 5283 Edge Park Way
- 10853 Valldemosa Ln
- 10652 Esmeraldas Dr
- 10654 Esmeraldas Dr
- 10674 Esmeraldas Dr
- 10653 Esmeraldas Dr
- 10672 Esmeraldas Dr
- 10656 Esmeraldas Dr
- 10648 Esmeraldas Dr
- 10670 Esmeraldas Dr
- 10646 Esmeraldas Dr
- 10651 Esmeraldas Dr
- 10655 Esmeraldas Dr
- 10644 Esmeraldas Dr
- 10675 Esmeraldas Dr
- 10658 Esmeraldas Dr
- 10642 Esmeraldas Dr
- 10649 Esmeraldas Dr
- 10664 Esmeraldas Dr
- 10673 Esmeraldas Dr
- 10657 Esmeraldas Dr
- 10660 Esmeraldas Dr