10655 Cherry Hills Dr Cherry Valley, CA 92223
Estimated Value: $369,945 - $383,000
2
Beds
2
Baths
1,471
Sq Ft
$256/Sq Ft
Est. Value
About This Home
This home is located at 10655 Cherry Hills Dr, Cherry Valley, CA 92223 and is currently estimated at $377,236, approximately $256 per square foot. 10655 Cherry Hills Dr is a home located in Riverside County with nearby schools including Starlight Elementary School, San Gorgonio Middle School, and Beaumont Senior High School.
Ownership History
Date
Name
Owned For
Owner Type
Purchase Details
Closed on
Dec 11, 2017
Sold by
Young Terry W and Young Joan W
Bought by
Young Joan W and Young Trust
Current Estimated Value
Purchase Details
Closed on
Feb 7, 2002
Sold by
Triepke Kenneth J and Triepke Bonnie J
Bought by
Young Terry W and Young Joan W
Home Financials for this Owner
Home Financials are based on the most recent Mortgage that was taken out on this home.
Original Mortgage
$120,000
Outstanding Balance
$49,373
Interest Rate
6.99%
Estimated Equity
$327,863
Purchase Details
Closed on
Apr 29, 1998
Sold by
Wartburg Theological Seminary
Bought by
Triepke Kenneth J and Triepke Bonnie J
Home Financials for this Owner
Home Financials are based on the most recent Mortgage that was taken out on this home.
Original Mortgage
$80,800
Interest Rate
7.07%
Purchase Details
Closed on
Dec 4, 1997
Sold by
Schultz John A and Schultz Bernice M
Bought by
Wartburg Theological Seminary
Create a Home Valuation Report for This Property
The Home Valuation Report is an in-depth analysis detailing your home's value as well as a comparison with similar homes in the area
Home Values in the Area
Average Home Value in this Area
Purchase History
| Date | Buyer | Sale Price | Title Company |
|---|---|---|---|
| Young Joan W | -- | None Available | |
| Young Terry W | $160,000 | -- | |
| Triepke Kenneth J | $101,000 | Commonwealth Land Title Co | |
| Wartburg Theological Seminary | -- | -- |
Source: Public Records
Mortgage History
| Date | Status | Borrower | Loan Amount |
|---|---|---|---|
| Open | Young Terry W | $120,000 | |
| Previous Owner | Triepke Kenneth J | $80,800 |
Source: Public Records
Tax History Compared to Growth
Tax History
| Year | Tax Paid | Tax Assessment Tax Assessment Total Assessment is a certain percentage of the fair market value that is determined by local assessors to be the total taxable value of land and additions on the property. | Land | Improvement |
|---|---|---|---|---|
| 2025 | $2,941 | $231,907 | $66,463 | $165,444 |
| 2023 | $2,941 | $222,903 | $63,883 | $159,020 |
| 2022 | $2,893 | $218,533 | $62,631 | $155,902 |
| 2021 | $2,837 | $214,249 | $61,403 | $152,846 |
| 2020 | $2,806 | $212,053 | $60,774 | $151,279 |
| 2019 | $2,761 | $207,896 | $59,583 | $148,313 |
| 2018 | $2,749 | $203,820 | $58,415 | $145,405 |
| 2017 | $2,704 | $199,824 | $57,270 | $142,554 |
| 2016 | $2,632 | $195,907 | $56,148 | $139,759 |
| 2015 | $2,587 | $192,965 | $55,305 | $137,660 |
| 2014 | $2,391 | $175,000 | $50,000 | $125,000 |
Source: Public Records
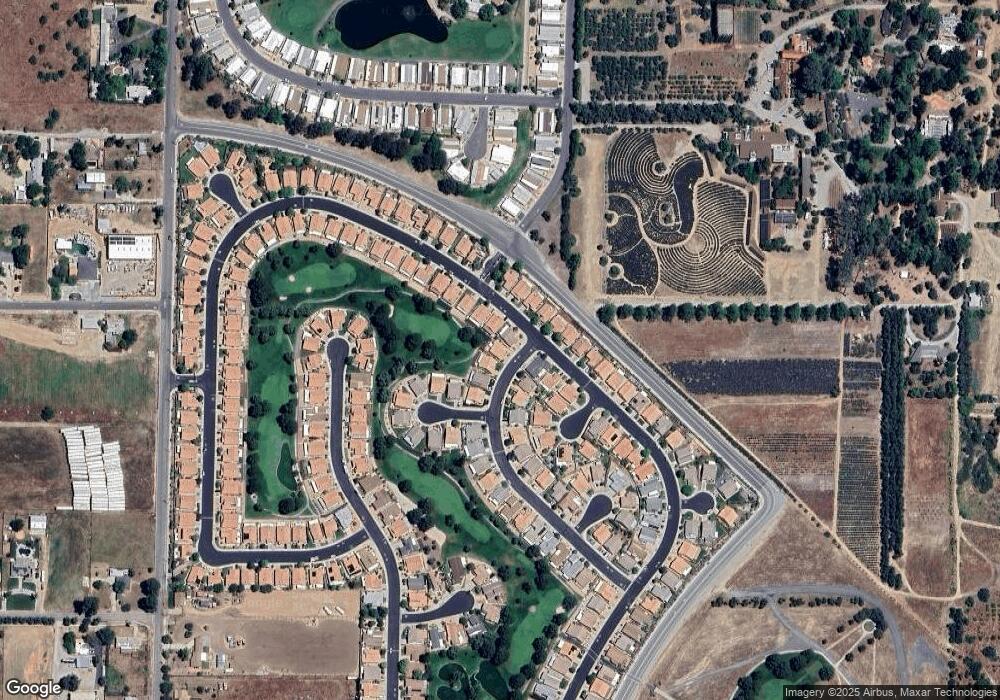
Map
Nearby Homes
- 10676 Cherry Hills Dr
- 41030 Inverness Cir
- 10745 Cherry Hills Dr
- 10775 Bel Air Dr
- 10811 Bel Air Dr
- 10751 Deerfield Dr
- 10497 Bel Air Dr
- 10493 Overland Trail
- 10475 Frontier Trail
- 40833 Caballero Dr
- 10311 Bel Air Dr
- 10420 Bel Air Dr
- 10435 Frontier Trail
- 10870 Deerfield Dr
- 10980 Bel Air Dr
- 10765 Chisholm Trail
- 10921 Deerfield Dr
- 41238 Cheyenne Trail
- 10280 Cimarron Trail
- 10260 Cimarron Trail
- 10645 Cherry Hills Dr
- 10665 Cherry Hills Dr
- 10651 Bel Air Dr
- 10675 Cherry Hills Dr
- 10641 Bel Air Dr
- 10691 Bel Air Dr
- 10666 Cherry Hills Dr
- 10685 Cherry Hills Dr
- 10631 Bel Air Dr
- 10660 Bel Air Dr
- 10670 Bel Air Dr
- 41840 Candlewood Dr
- 10701 Bel Air Dr
- 10680 Bel Air Dr
- 10640 Bel Air Dr
- 10690 Cherry Hills Dr
- 10621 Bel Air Dr
- 41830 Candlewood Dr
- 10690 Bel Air Dr
- 41050 Inverness Cir