10656 Rancho Carmel Dr Unit 76 San Diego, CA 92128
Carmel Mountain NeighborhoodEstimated Value: $925,000 - $1,145,000
3
Beds
3
Baths
1,638
Sq Ft
$640/Sq Ft
Est. Value
About This Home
This home is located at 10656 Rancho Carmel Dr Unit 76, San Diego, CA 92128 and is currently estimated at $1,047,785, approximately $639 per square foot. 10656 Rancho Carmel Dr Unit 76 is a home located in San Diego County with nearby schools including Shoal Creek Elementary School, Meadowbrook Middle, and Rancho Bernardo High.
Ownership History
Date
Name
Owned For
Owner Type
Purchase Details
Closed on
Oct 15, 2009
Sold by
Willet Carmen A
Bought by
Conroy Hendrik J and Conroy Elizabeth R
Current Estimated Value
Home Financials for this Owner
Home Financials are based on the most recent Mortgage that was taken out on this home.
Original Mortgage
$300,000
Outstanding Balance
$195,094
Interest Rate
5%
Mortgage Type
New Conventional
Estimated Equity
$852,691
Purchase Details
Closed on
May 12, 1998
Sold by
Degeus Scott K and Degeus Nancy J
Bought by
Willett Carmen A
Home Financials for this Owner
Home Financials are based on the most recent Mortgage that was taken out on this home.
Original Mortgage
$37,000
Interest Rate
7.1%
Mortgage Type
Purchase Money Mortgage
Purchase Details
Closed on
Dec 31, 1986
Create a Home Valuation Report for This Property
The Home Valuation Report is an in-depth analysis detailing your home's value as well as a comparison with similar homes in the area
Home Values in the Area
Average Home Value in this Area
Purchase History
| Date | Buyer | Sale Price | Title Company |
|---|---|---|---|
| Conroy Hendrik J | $401,000 | Corinthian Title Company | |
| Willett Carmen A | $214,000 | Lawyers Title | |
| -- | $138,500 | -- |
Source: Public Records
Mortgage History
| Date | Status | Borrower | Loan Amount |
|---|---|---|---|
| Open | Conroy Hendrik J | $300,000 | |
| Previous Owner | Willett Carmen A | $37,000 |
Source: Public Records
Tax History Compared to Growth
Tax History
| Year | Tax Paid | Tax Assessment Tax Assessment Total Assessment is a certain percentage of the fair market value that is determined by local assessors to be the total taxable value of land and additions on the property. | Land | Improvement |
|---|---|---|---|---|
| 2025 | $5,704 | $517,600 | $361,419 | $156,181 |
| 2024 | $5,704 | $507,452 | $354,333 | $153,119 |
| 2023 | $5,583 | $497,503 | $347,386 | $150,117 |
| 2022 | $5,486 | $487,749 | $340,575 | $147,174 |
| 2021 | $5,411 | $478,187 | $333,898 | $144,289 |
| 2020 | $5,338 | $473,285 | $330,475 | $142,810 |
| 2019 | $5,198 | $464,006 | $323,996 | $140,010 |
| 2018 | $5,048 | $454,909 | $317,644 | $137,265 |
| 2017 | $4,913 | $445,990 | $311,416 | $134,574 |
| 2016 | $4,811 | $437,246 | $305,310 | $131,936 |
| 2015 | $4,739 | $430,679 | $300,724 | $129,955 |
| 2014 | $4,626 | $422,244 | $294,834 | $127,410 |
Source: Public Records
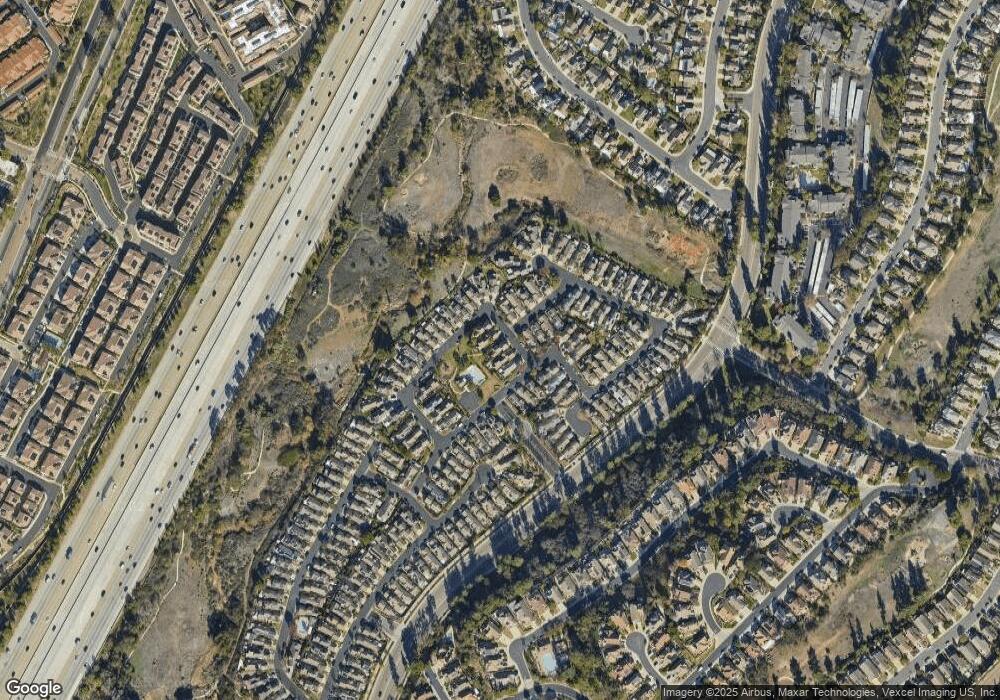
Map
Nearby Homes
- 10572 Rancho Carmel Dr
- 10378 Rancho Carmel Dr
- 10366 Rancho Carmel Dr
- 10462 Rancho Carmel Dr
- 11011 Peyton Way
- 10861 Blake Way
- 12021 Sienna Ln
- 11033 Bryce Way
- Residence 3 Plan at The Trails - Ashton
- Residence 2 Plan at The Trails - Ashton
- Residence 1 Plan at The Trails - Ashton
- 13722 Stoney Gate Place
- 14136 Capewood Ln
- 14139 Caminito Quevedo
- 10709 Audrey Way
- 14112 Stoney Gate Place
- 11052 Via San Marco Unit 22
- 11244 Woodrush Ln
- 14125 Korrey Dr
- 11020 Via Parma
- 10694 Rancho Carmel Dr
- 10666 Rancho Carmel Dr
- 10658 Rancho Carmel Dr Unit 77
- 10530 Rancho Carmel Dr
- 10528 Rancho Carmel Dr
- 10520 Rancho Carmel Dr Unit 10
- 10514 Rancho Carmel Dr
- 10510 Rancho Carmel Dr
- 10508 Rancho Carmel Dr Unit 4
- 10506 Rancho Carmel Dr
- 10698 Rancho Carmel Dr Unit 97
- 10668 Rancho Carmel Dr Unit 82
- 10660 Rancho Carmel Dr
- 10504 Rancho Carmel Dr
- 10502 Rancho Carmel Dr Unit 16
- 10662 Rancho Carmel Dr
- 10654 Rancho Carmel Dr Unit 75
- 10642 Rancho Carmel Dr
- 10638 Rancho Carmel Dr Unit 68
- 10636 Rancho Carmel Dr