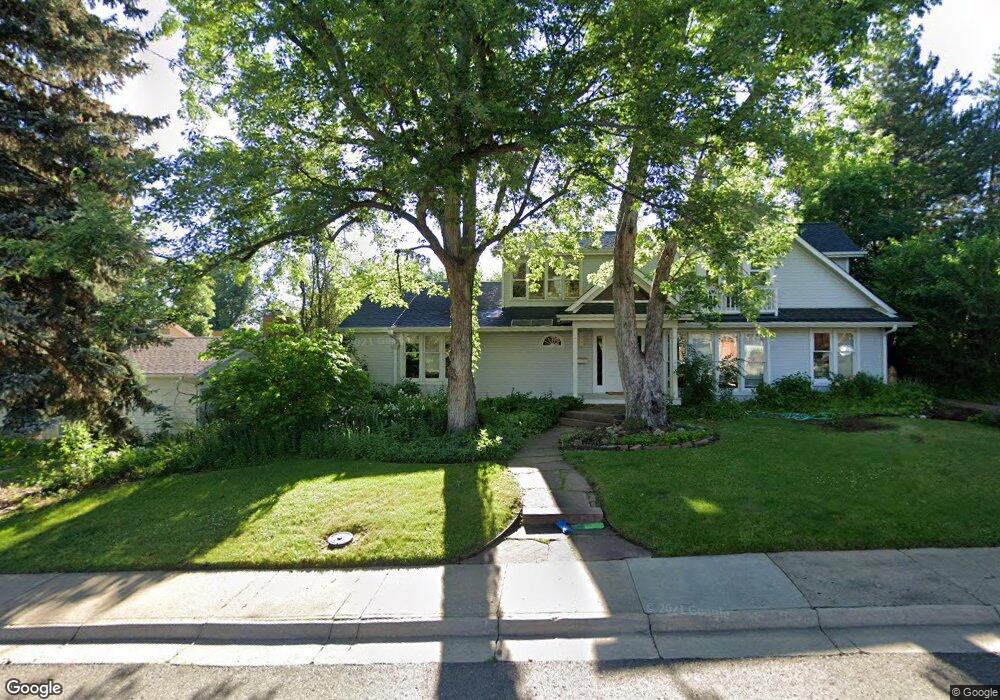
1066 8th St Boulder, CO 80302
University Hill NeighborhoodEstimated Value: $2,160,159 - $2,829,000
3
Beds
4
Baths
2,908
Sq Ft
$881/Sq Ft
Est. Value
About This Home
This home is located at 1066 8th St, Boulder, CO 80302 and is currently estimated at $2,560,790, approximately $880 per square foot. 1066 8th St is a home located in Boulder County with nearby schools including Flatirons Elementary School, Manhattan Middle School of the Arts & Academics, and Boulder High School.
Ownership History
Date
Name
Owned For
Owner Type
Purchase Details
Closed on
Jan 13, 2006
Sold by
Edgar Lois G and Estate Of H Bentley Glass
Bought by
Edgar Lois G
Current Estimated Value
Purchase Details
Closed on
Jul 19, 1999
Sold by
Bentley Edgar Lois G and Bentley H
Bought by
Glass H Bentley
Home Financials for this Owner
Home Financials are based on the most recent Mortgage that was taken out on this home.
Original Mortgage
$142,500
Interest Rate
7.02%
Purchase Details
Closed on
Jun 11, 1999
Sold by
Edgar Lois G
Bought by
Edgar Lois G
Home Financials for this Owner
Home Financials are based on the most recent Mortgage that was taken out on this home.
Original Mortgage
$142,500
Interest Rate
7.02%
Purchase Details
Closed on
Mar 11, 1988
Bought by
Edgar Lois G
Purchase Details
Closed on
Dec 26, 1986
Bought by
Edgar Lois G
Create a Home Valuation Report for This Property
The Home Valuation Report is an in-depth analysis detailing your home's value as well as a comparison with similar homes in the area
Home Values in the Area
Average Home Value in this Area
Purchase History
| Date | Buyer | Sale Price | Title Company |
|---|---|---|---|
| Edgar Lois G | -- | None Available | |
| Glass H Bentley | -- | -- | |
| Edgar Lois G | -- | -- | |
| Edgar Lois G | $177,400 | -- | |
| Edgar Lois G | $93,500 | -- |
Source: Public Records
Mortgage History
| Date | Status | Borrower | Loan Amount |
|---|---|---|---|
| Closed | Edgar Lois G | $142,500 |
Source: Public Records
Tax History
| Year | Tax Paid | Tax Assessment Tax Assessment Total Assessment is a certain percentage of the fair market value that is determined by local assessors to be the total taxable value of land and additions on the property. | Land | Improvement |
|---|---|---|---|---|
| 2025 | $13,352 | $152,650 | $109,206 | $43,444 |
| 2024 | $13,120 | $158,623 | $108,983 | $49,640 |
| 2023 | $13,120 | $158,623 | $112,667 | $49,640 |
| 2022 | $11,295 | $128,582 | $95,055 | $33,527 |
| 2021 | $10,771 | $132,283 | $97,791 | $34,492 |
| 2020 | $10,179 | $124,095 | $92,378 | $31,717 |
| 2019 | $10,024 | $124,095 | $92,378 | $31,717 |
| 2018 | $8,900 | $109,850 | $58,104 | $51,746 |
| 2017 | $8,621 | $121,446 | $64,237 | $57,209 |
| 2016 | $7,132 | $90,346 | $38,845 | $51,501 |
| 2015 | $6,753 | $77,124 | $39,561 | $37,563 |
| 2014 | $5,815 | $77,124 | $39,561 | $37,563 |
Source: Public Records
Map
Nearby Homes
- 780 College Ave
- 1021 9th St
- 964 Grant Place
- 1128 Lincoln Place
- 505 Geneva Ave
- 972 Pleasant St
- 920 University Ave
- 911 Lincoln Place
- 610 University Ave
- 820 6th St
- 800 Grant Place
- 611 Cascade Ave Unit 7
- 623 Marine St
- 751 Grant Place
- 440 Christmas Tree Dr
- 944 Arapahoe Ave Unit A
- 944 Arapahoe Ave Unit B
- 1405 Broadway St Unit 307
- 1405 Broadway St Unit 206
- 1405 Broadway St Unit 102
Your Personal Tour Guide
Ask me questions while you tour the home.