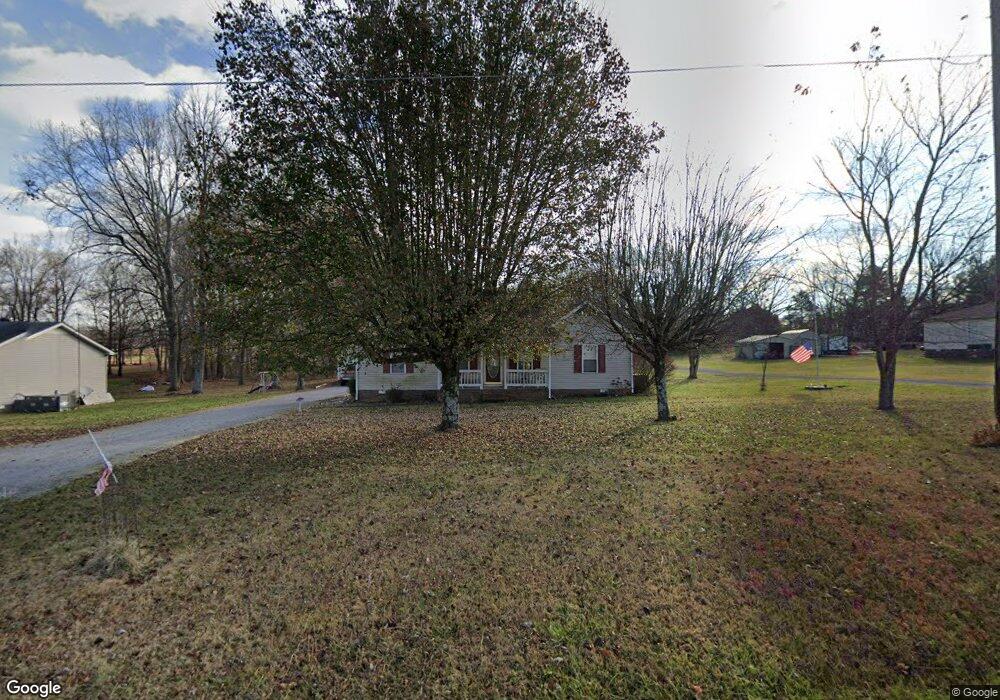
1066 Jack Porter Rd Lafayette, TN 37083
Estimated Value: $240,163 - $291,000
--
Bed
2
Baths
1,540
Sq Ft
$179/Sq Ft
Est. Value
About This Home
This home is located at 1066 Jack Porter Rd, Lafayette, TN 37083 and is currently estimated at $275,291, approximately $178 per square foot. 1066 Jack Porter Rd is a home located in Macon County with nearby schools including Macon Christian Academy.
Ownership History
Date
Name
Owned For
Owner Type
Purchase Details
Closed on
Jan 4, 2021
Sold by
Guffie Kristie L Carter Cothron and Cothron Kristiel L
Bought by
Guffie Kristie L Carter and Guffie Anthony W
Current Estimated Value
Home Financials for this Owner
Home Financials are based on the most recent Mortgage that was taken out on this home.
Original Mortgage
$111,500
Outstanding Balance
$81,508
Interest Rate
2.7%
Mortgage Type
New Conventional
Estimated Equity
$193,783
Purchase Details
Closed on
Nov 1, 2011
Sold by
Cothron Bill
Bought by
Cothron Kristie L Carter
Purchase Details
Closed on
Oct 25, 2001
Sold by
Michael Fletcher James
Bought by
Carter Kristie L
Purchase Details
Closed on
Jan 31, 2001
Sold by
Roy Woodard
Bought by
Kristie Carter
Purchase Details
Closed on
Mar 25, 1999
Sold by
Woodard Roy C
Bought by
Noles Gregory S
Purchase Details
Closed on
Mar 2, 1998
Bought by
Woodard Roy C and Woodard Erica Claiborne
Purchase Details
Closed on
Oct 25, 1993
Bought by
Jenkins Darrell
Create a Home Valuation Report for This Property
The Home Valuation Report is an in-depth analysis detailing your home's value as well as a comparison with similar homes in the area
Home Values in the Area
Average Home Value in this Area
Purchase History
| Date | Buyer | Sale Price | Title Company |
|---|---|---|---|
| Guffie Kristie L Carter | -- | First American Mortgage Sln | |
| Guffie Kristie L Carter | -- | None Listed On Document | |
| Cothron Kristie L Carter | -- | -- | |
| Carter Kristie L | -- | -- | |
| Kristie Carter | $71,000 | -- | |
| Noles Gregory S | $71,000 | -- | |
| Woodard Roy C | $62,300 | -- | |
| Jenkins Darrell | -- | -- |
Source: Public Records
Mortgage History
| Date | Status | Borrower | Loan Amount |
|---|---|---|---|
| Open | Guffie Kristie L Carter | $111,500 | |
| Closed | Guffie Kristie L Carter | $111,500 |
Source: Public Records
Tax History Compared to Growth
Tax History
| Year | Tax Paid | Tax Assessment Tax Assessment Total Assessment is a certain percentage of the fair market value that is determined by local assessors to be the total taxable value of land and additions on the property. | Land | Improvement |
|---|---|---|---|---|
| 2024 | $722 | $51,925 | $4,075 | $47,850 |
| 2023 | $722 | $51,075 | $0 | $0 |
| 2022 | $688 | $28,650 | $1,725 | $26,925 |
| 2021 | $688 | $28,650 | $1,725 | $26,925 |
| 2020 | $585 | $24,375 | $1,725 | $22,650 |
| 2019 | $585 | $24,375 | $1,725 | $22,650 |
| 2018 | $660 | $29,825 | $1,725 | $28,100 |
| 2017 | $719 | $28,550 | $2,475 | $26,075 |
| 2016 | $685 | $28,550 | $2,475 | $26,075 |
| 2015 | $685 | $28,550 | $2,475 | $26,075 |
| 2014 | $685 | $28,542 | $0 | $0 |
Source: Public Records
Map
Nearby Homes
- 849 Jack Porter Rd
- 0 Johns Creek Rd
- 317 Jack Porter Rd
- 4574 Long Creek Rd
- 4510 Long Creek Rd
- 1021 Maple Grove Rd
- 165 Pleasant Hill Rd
- 912 Long Creek Rd
- 10 Mcnabb Ln
- 43B Fairway Dr
- 788 Long Creek Rd
- 105 Gammons Ln
- 265 Evans Rd
- 90 Long Creek Rd
- 351 Michael Cir
- 79 Taylor Ln
- 73 Hayden Drake Ln
- 195 Froedge Dr
- 2901 Highway 52 W
- 1400 Dogwood Ln
- 1084 Jack Porter Rd
- 1036 Jack Porter Rd
- 1051 Jack Porter Rd
- 1091 Jack Porter Rd
- 1116 Jack Porter Rd
- 58 East Ln
- 955 Jack Porter Rd
- 84 East Ln
- 912 Jack Porter Rd
- 1050 Jack Porter Rd
- 883 Jack Porter Rd
- 848 Jack Porter Rd
- 1175 Jack Porter Rd
- 830 Jack Porter Rd
- 164 East Ln
- 810 Jack Porter Rd
- 790 Jack Porter Rd
- 772 Jack Porter Rd
- 754 Jack Porter Rd
- 1321 Jack Porter Rd