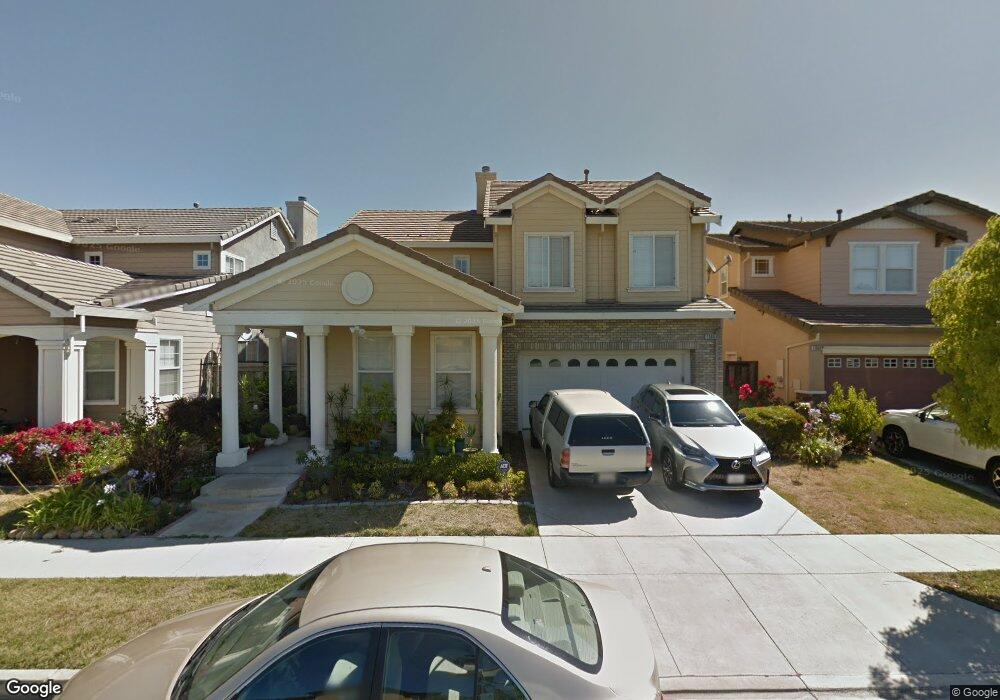
1066 Lantern Bay Hercules, CA 94547
New Pacific NeighborhoodEstimated Value: $929,236 - $1,057,000
5
Beds
3
Baths
2,730
Sq Ft
$364/Sq Ft
Est. Value
About This Home
This home is located at 1066 Lantern Bay, Hercules, CA 94547 and is currently estimated at $993,809, approximately $364 per square foot. 1066 Lantern Bay is a home located in Contra Costa County with nearby schools including Lupine Hills Elementary School, Hercules Middle School, and Hercules High School.
Ownership History
Date
Name
Owned For
Owner Type
Purchase Details
Closed on
Sep 24, 2012
Sold by
Fu Chi Wah and Fu Qi Ping
Bought by
Fu Chi Wah and Fu Qi Ping
Current Estimated Value
Home Financials for this Owner
Home Financials are based on the most recent Mortgage that was taken out on this home.
Original Mortgage
$356,250
Outstanding Balance
$246,808
Interest Rate
3.52%
Mortgage Type
New Conventional
Estimated Equity
$747,001
Purchase Details
Closed on
Apr 1, 2007
Sold by
Fu Chi Wah and Fu Qi Ping
Bought by
Fu Chi Wah and Fu Qi Ping
Purchase Details
Closed on
May 29, 2003
Sold by
Hercules Overlook Lp
Bought by
Fu Chi Wah and Fu Qi Ping
Home Financials for this Owner
Home Financials are based on the most recent Mortgage that was taken out on this home.
Original Mortgage
$333,700
Interest Rate
6.03%
Mortgage Type
Purchase Money Mortgage
Create a Home Valuation Report for This Property
The Home Valuation Report is an in-depth analysis detailing your home's value as well as a comparison with similar homes in the area
Home Values in the Area
Average Home Value in this Area
Purchase History
| Date | Buyer | Sale Price | Title Company |
|---|---|---|---|
| Fu Chi Wah | -- | Old Republic Title Company | |
| Fu Chi Wah | -- | Old Republic Title Company | |
| Fu Chi Wah | -- | None Available | |
| Fu Chi Wah | -- | First American Title |
Source: Public Records
Mortgage History
| Date | Status | Borrower | Loan Amount |
|---|---|---|---|
| Open | Fu Chi Wah | $356,250 | |
| Previous Owner | Fu Chi Wah | $333,700 | |
| Closed | Fu Chi Wah | $83,425 |
Source: Public Records
Tax History
| Year | Tax Paid | Tax Assessment Tax Assessment Total Assessment is a certain percentage of the fair market value that is determined by local assessors to be the total taxable value of land and additions on the property. | Land | Improvement |
|---|---|---|---|---|
| 2025 | $12,029 | $793,201 | $284,348 | $508,853 |
| 2024 | $11,338 | $777,649 | $278,773 | $498,876 |
| 2023 | $11,338 | $762,402 | $273,307 | $489,095 |
| 2022 | $11,185 | $747,454 | $267,949 | $479,505 |
| 2021 | $11,175 | $732,799 | $262,696 | $470,103 |
| 2019 | $10,564 | $711,065 | $254,905 | $456,160 |
| 2018 | $10,233 | $697,123 | $249,907 | $447,216 |
| 2017 | $10,272 | $683,455 | $245,007 | $438,448 |
| 2016 | $9,580 | $630,500 | $226,024 | $404,476 |
| 2015 | $8,907 | $568,500 | $203,797 | $364,703 |
| 2014 | $8,424 | $525,500 | $188,383 | $337,117 |
Source: Public Records
Map
Nearby Homes
- 106 White Cap Cove
- 1012 Rock Harbor Point
- 601 Napa Ave
- 836 Hawthorne Dr
- 215 4th St
- 343 Rodeo Ave
- 511 Third St
- 1334 7th St
- 229 Lake Ave
- 1027 3rd St
- 909 Seascape Cir
- 139 Rodeo Ave
- 220 Vaqueros Ave
- 801 Dover
- 802 Dover
- 834 Coral Ridge Cir
- 176 Bedford
- 704 Windsor Unit 704
- 797 Coral Ridge Cir
- 120 Bonita Ct
- 1072 Lantern Bay
- 1060 Lantern Bay
- 1078 Lantern Bay
- 1054 Lantern Bay
- 1057 Lantern Bay
- 1063 Lantern Bay
- 1048 Lantern Bay
- 1084 Lantern Bay
- 1051 Lantern Bay
- 1069 Lantern Bay
- 1075 Lantern Bay
- 1045 Lantern Bay
- 1090 Lantern Bay
- 1042 Lantern Bay
- 1036 Lantern Bay
- 1096 Lantern Bay
- 115 Spinnaker Cove
- 121 Spinnaker Cove
- 1087 Lantern Bay
- 1102 Lantern Bay
Your Personal Tour Guide
Ask me questions while you tour the home.