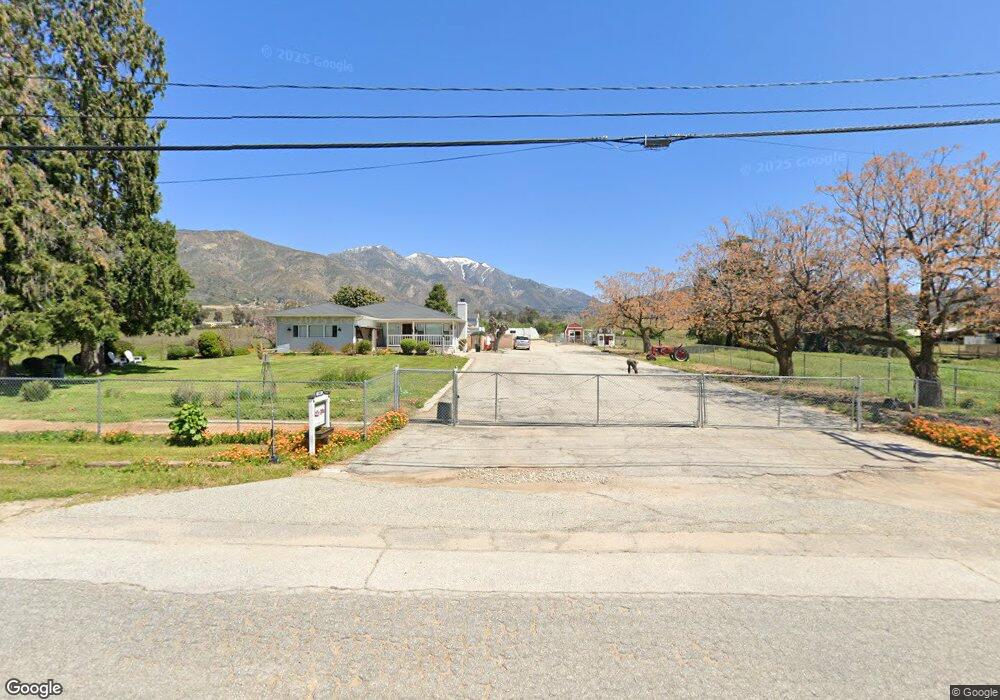
10665 Fremont St Yucaipa, CA 92399
Upper Yucaipa-Rolling Hills NeighborhoodEstimated Value: $514,000 - $707,000
1
Bed
1
Bath
892
Sq Ft
$714/Sq Ft
Est. Value
About This Home
This home is located at 10665 Fremont St, Yucaipa, CA 92399 and is currently estimated at $636,667, approximately $713 per square foot. 10665 Fremont St is a home located in San Bernardino County with nearby schools including Ridgeview Elementary School, Park View Middle School, and Yucaipa High School.
Ownership History
Date
Name
Owned For
Owner Type
Purchase Details
Closed on
Sep 29, 2008
Sold by
East West Bank
Bought by
Km Investments Llc
Current Estimated Value
Home Financials for this Owner
Home Financials are based on the most recent Mortgage that was taken out on this home.
Original Mortgage
$945,000
Outstanding Balance
$627,197
Interest Rate
6.39%
Mortgage Type
Purchase Money Mortgage
Estimated Equity
$9,470
Purchase Details
Closed on
Mar 31, 2005
Sold by
Kirkpatrick Bonnie I
Bought by
Yucaipa Land Holdings Llc
Create a Home Valuation Report for This Property
The Home Valuation Report is an in-depth analysis detailing your home's value as well as a comparison with similar homes in the area
Home Values in the Area
Average Home Value in this Area
Purchase History
| Date | Buyer | Sale Price | Title Company |
|---|---|---|---|
| Km Investments Llc | -- | North American Title Co | |
| Yucaipa Land Holdings Llc | $300,000 | First American Title Company |
Source: Public Records
Mortgage History
| Date | Status | Borrower | Loan Amount |
|---|---|---|---|
| Open | Km Investments Llc | $945,000 |
Source: Public Records
Tax History Compared to Growth
Tax History
| Year | Tax Paid | Tax Assessment Tax Assessment Total Assessment is a certain percentage of the fair market value that is determined by local assessors to be the total taxable value of land and additions on the property. | Land | Improvement |
|---|---|---|---|---|
| 2025 | $4,330 | $379,891 | $378,602 | $1,289 |
| 2024 | $4,330 | $372,442 | $371,178 | $1,264 |
| 2023 | $4,313 | $365,139 | $363,900 | $1,239 |
| 2022 | $4,264 | $357,980 | $356,765 | $1,215 |
| 2021 | $4,211 | $350,961 | $349,770 | $1,191 |
| 2020 | $4,253 | $347,363 | $346,184 | $1,179 |
| 2019 | $4,140 | $340,552 | $339,396 | $1,156 |
| 2018 | $4,042 | $333,874 | $332,741 | $1,133 |
| 2017 | $3,953 | $327,328 | $326,217 | $1,111 |
| 2016 | $3,901 | $320,910 | $319,821 | $1,089 |
| 2015 | $3,860 | $316,090 | $315,017 | $1,073 |
| 2014 | $3,782 | $309,898 | $308,846 | $1,052 |
Source: Public Records
Map
Nearby Homes
- 10927 Deer Valley Rd
- 35602 Carter St
- 10675 Bryant St Unit 109
- 10675 Bryant St Unit 112
- 35425 Fir Ave
- 35493 Balsa St
- 0 Jefferson St Unit OC25219913
- 0 Jefferson St Unit EV24004395
- 0 Holly Ave Unit IG24202833
- 35488 Schafer Ranch Rd
- 11111 Cherry Croft Dr
- 35892 Oak Glen Rd
- 35377 Shade Tree Rd
- 35218 Fir Ave Unit 30
- 35218 Fir Ave Unit 183
- 35218 Fir Ave Unit 15
- 10622 Bryant St Unit 54
- 35246 Silver Leaf Cir
- 35110 Willow Springs Dr
- 11050 Bryant St Unit 78
- 10625 Fremont St
- 10729 Fremont St
- 35835 Carter St
- 35686 Oleander Ave
- 35687 Oleander Ave
- 10597 Fremont St
- 35871 Carter St
- 10567 Fremont St
- 35667 Oleander Ave
- 35666 Oleander Ave
- 10533 Fremont St
- 10730 Jefferson St
- 35685 Sleepy Hollow Ln
- 35826 Fir Ave
- 35837 Carter St
- 35813 Carter St
- 35647 Oleander Ave
- 35646 Oleander Ave
- 35669 Sleepy Hollow Ln
- 35751 Carter St