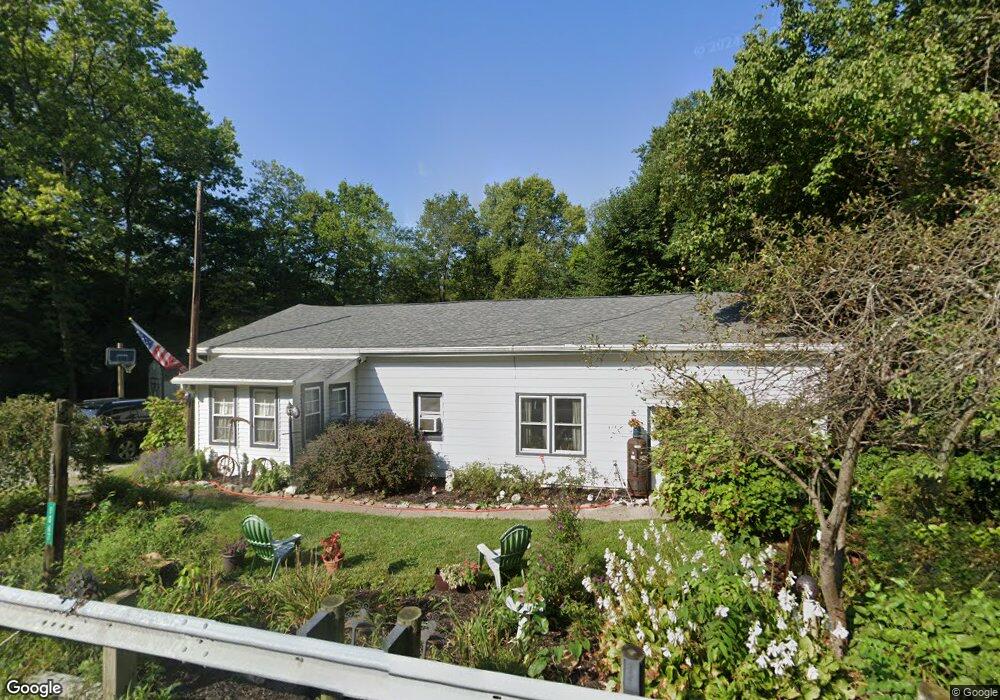
1067 N State Route 123 Lebanon, OH 45036
Turtlecreek Township NeighborhoodEstimated Value: $148,000 - $324,000
2
Beds
1
Bath
1,540
Sq Ft
$163/Sq Ft
Est. Value
About This Home
This home is located at 1067 N State Route 123, Lebanon, OH 45036 and is currently estimated at $251,133, approximately $163 per square foot. 1067 N State Route 123 is a home located in Warren County with nearby schools including Bowman Primary School, Berry Intermediate School, and Donovan Elementary School.
Ownership History
Date
Name
Owned For
Owner Type
Purchase Details
Closed on
Jun 7, 1999
Sold by
Stine Michael J
Bought by
Sellers Jesse D and Sellers Connie J
Current Estimated Value
Purchase Details
Closed on
Sep 26, 1995
Sold by
Michael Larry D
Bought by
Stine Michael J
Home Financials for this Owner
Home Financials are based on the most recent Mortgage that was taken out on this home.
Original Mortgage
$52,000
Interest Rate
7.78%
Mortgage Type
New Conventional
Purchase Details
Closed on
Mar 7, 1995
Sold by
Mccarty Brothers Inc
Bought by
Michael Larry D
Home Financials for this Owner
Home Financials are based on the most recent Mortgage that was taken out on this home.
Original Mortgage
$20,000
Interest Rate
9%
Mortgage Type
New Conventional
Purchase Details
Closed on
Oct 2, 1981
Sold by
Wells Wells and Wells Odus P
Create a Home Valuation Report for This Property
The Home Valuation Report is an in-depth analysis detailing your home's value as well as a comparison with similar homes in the area
Home Values in the Area
Average Home Value in this Area
Purchase History
| Date | Buyer | Sale Price | Title Company |
|---|---|---|---|
| Sellers Jesse D | $70,000 | -- | |
| Stine Michael J | $64,000 | -- | |
| Michael Larry D | $40,000 | -- | |
| -- | -- | -- |
Source: Public Records
Mortgage History
| Date | Status | Borrower | Loan Amount |
|---|---|---|---|
| Previous Owner | Stine Michael J | $52,000 | |
| Previous Owner | Michael Larry D | $20,000 |
Source: Public Records
Tax History Compared to Growth
Tax History
| Year | Tax Paid | Tax Assessment Tax Assessment Total Assessment is a certain percentage of the fair market value that is determined by local assessors to be the total taxable value of land and additions on the property. | Land | Improvement |
|---|---|---|---|---|
| 2024 | $2,439 | $59,770 | $23,100 | $36,670 |
| 2023 | $2,053 | $45,419 | $12,915 | $32,504 |
| 2022 | $2,025 | $45,420 | $12,915 | $32,505 |
| 2021 | $1,879 | $45,420 | $12,915 | $32,505 |
| 2020 | $1,860 | $36,925 | $10,500 | $26,425 |
| 2019 | $2,263 | $36,925 | $10,500 | $26,425 |
| 2018 | $2,102 | $36,925 | $10,500 | $26,425 |
| 2017 | $2,105 | $33,401 | $9,632 | $23,769 |
| 2016 | $2,167 | $33,401 | $9,632 | $23,769 |
| 2015 | $2,173 | $33,401 | $9,632 | $23,769 |
| 2014 | $1,644 | $30,090 | $8,680 | $21,410 |
| 2013 | $1,647 | $36,410 | $10,500 | $25,910 |
Source: Public Records
Map
Nearby Homes
- 711 Tollhouse Blvd
- 743 Tollhouse Blvd
- 714 Tollhouse Blvd
- 470 Pleasant Ridge Dr
- 416 Summerlyn Farms Ct
- 660 Carson Dr
- 5101 Greenview Ln
- 470 Georgetown Dr
- 759 Lake Bluff (Lot 12) Ct
- 755 Lake Bluff (Lot 11) Ct
- 743 Lake Bluff Ct
- 747 Lake Bluff (Lot 9) Ct
- 764 Lake Bluff (Lot 1) Ct
- 751 Lake Bluff Ct
- 760 Lake Bluff (Lot 2) Ct
- 756 Lake Bluff (Lot 3) Ct
- 740 Lake Bluff (Lot 7) Ct
- 748 Lake Bluff (Lot 5) Ct
- 744 Ct
- A Ohio 63
- 1067 Ohio 123 Unit 1113
- 1067 Ohio 123
- 1750 Greentree Rd
- 1850 Greentree Rd Unit 205
- 1028 N State Route 123
- 1028 N State Route 123
- 1028 N State Route 123
- 1790 Greentree Rd
- 1790 Greentree Rd Unit 3
- 1881 Greentree Rd
- 1132 N State Route 123
- 1883 Greentree Rd
- 1820 Greentree Rd
- 1820 Greentree Rd Unit 1
- 1810 Greentree Rd
- 990 N State Route 123
- 1833 Greentree Rd Unit 187
- 1887 Greentree Rd
- 1845 Greentree Rd Unit 189
- 1851 Greentree Rd Unit 190