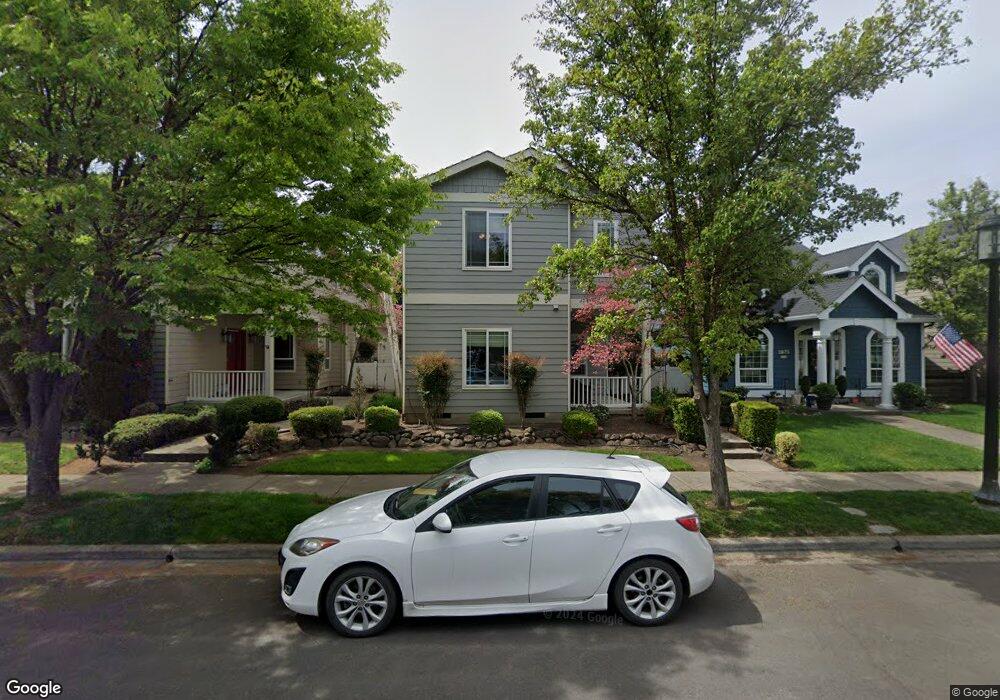
1067 Rustler Peak St Central Point, OR 97502
Estimated Value: $395,000 - $496,000
3
Beds
2
Baths
1,700
Sq Ft
$263/Sq Ft
Est. Value
About This Home
This home is located at 1067 Rustler Peak St, Central Point, OR 97502 and is currently estimated at $446,592, approximately $262 per square foot. 1067 Rustler Peak St is a home located in Jackson County with nearby schools including Richardson Elementary School, Scenic Middle School, and Crater High School.
Ownership History
Date
Name
Owned For
Owner Type
Purchase Details
Closed on
Dec 23, 2024
Sold by
Bonner Gary C and Bonner Pauline H
Bought by
Bonner Family Trust and Bonner
Current Estimated Value
Purchase Details
Closed on
Jun 15, 2005
Sold by
Lori Magel Homes Inc
Bought by
Bonner Gary C and Bonner Pauline H
Home Financials for this Owner
Home Financials are based on the most recent Mortgage that was taken out on this home.
Original Mortgage
$151,200
Interest Rate
5.72%
Mortgage Type
Purchase Money Mortgage
Purchase Details
Closed on
Jan 24, 2005
Sold by
Twin Creeks Development Co Llc
Bought by
Lori Magel Homes Inc
Home Financials for this Owner
Home Financials are based on the most recent Mortgage that was taken out on this home.
Original Mortgage
$170,600
Interest Rate
5.69%
Mortgage Type
Construction
Create a Home Valuation Report for This Property
The Home Valuation Report is an in-depth analysis detailing your home's value as well as a comparison with similar homes in the area
Home Values in the Area
Average Home Value in this Area
Purchase History
| Date | Buyer | Sale Price | Title Company |
|---|---|---|---|
| Bonner Family Trust | -- | None Listed On Document | |
| Bonner Gary C | $226,112 | Lawyers Title Ins | |
| Lori Magel Homes Inc | $50,000 | Lawyers Title Ins |
Source: Public Records
Mortgage History
| Date | Status | Borrower | Loan Amount |
|---|---|---|---|
| Previous Owner | Bonner Gary C | $151,200 | |
| Previous Owner | Lori Magel Homes Inc | $170,600 |
Source: Public Records
Tax History Compared to Growth
Tax History
| Year | Tax Paid | Tax Assessment Tax Assessment Total Assessment is a certain percentage of the fair market value that is determined by local assessors to be the total taxable value of land and additions on the property. | Land | Improvement |
|---|---|---|---|---|
| 2025 | $4,247 | $255,440 | $100,810 | $154,630 |
| 2024 | $4,247 | $248,000 | $97,870 | $150,130 |
| 2023 | $4,110 | $240,780 | $95,020 | $145,760 |
| 2022 | $4,014 | $240,780 | $95,020 | $145,760 |
| 2021 | $3,900 | $233,770 | $92,260 | $141,510 |
| 2020 | $3,786 | $226,970 | $89,570 | $137,400 |
| 2019 | $3,693 | $213,950 | $84,420 | $129,530 |
| 2018 | $3,580 | $207,720 | $81,960 | $125,760 |
| 2017 | $3,490 | $207,720 | $81,960 | $125,760 |
| 2016 | $3,388 | $195,800 | $77,260 | $118,540 |
| 2015 | $3,246 | $195,800 | $77,260 | $118,540 |
| 2014 | $3,164 | $184,570 | $72,830 | $111,740 |
Source: Public Records
Map
Nearby Homes
- 1159 Rustler Peak St
- 526 Stone Pointe Dr
- 1135 Shake Dr
- 1167 Boulder Ridge St
- 0 Boulder Ridge St
- 629 Bridge Creek Dr
- 1134 Steamboat Dr
- 1317 River Run St
- 1407 Rustler Peak St
- 426 Bridge Creek Dr
- 349 Cascade Dr
- 626 Griffin Oaks Dr
- 327 Brookhaven Dr
- 905 Comet Ave
- 422 Castle Rock Dr
- 4626 N Pacific Hwy
- 356 Marian Ave Unit 40
- 407 Silver Creek Dr
- 413 Sand Pointe Dr
- 619 Palo Verde Way
- 1059 Rustler Peak St
- 1075 Rustler Peak St
- 1051 Rustler Peak St
- 1083 Rustler Peak St
- 1043 Rustler Peak St
- 1091 Rustler Peak St
- 1034 Sandoz St
- 1040 Sandoz St
- 1035 Rustler Peak St
- 1028 Sandoz St
- 1044 Sandoz St
- 1022 Sandoz St
- 1099 Rustler Peak St
- 1027 Rustler Peak St
- 1086 Rustler Peak St
- 1019 Rustler Peak St
- 1016 Sandoz St
- 1090 Rustler Peak St
- 1094 Rustler Peak St
- 1011 Rustler Peak St