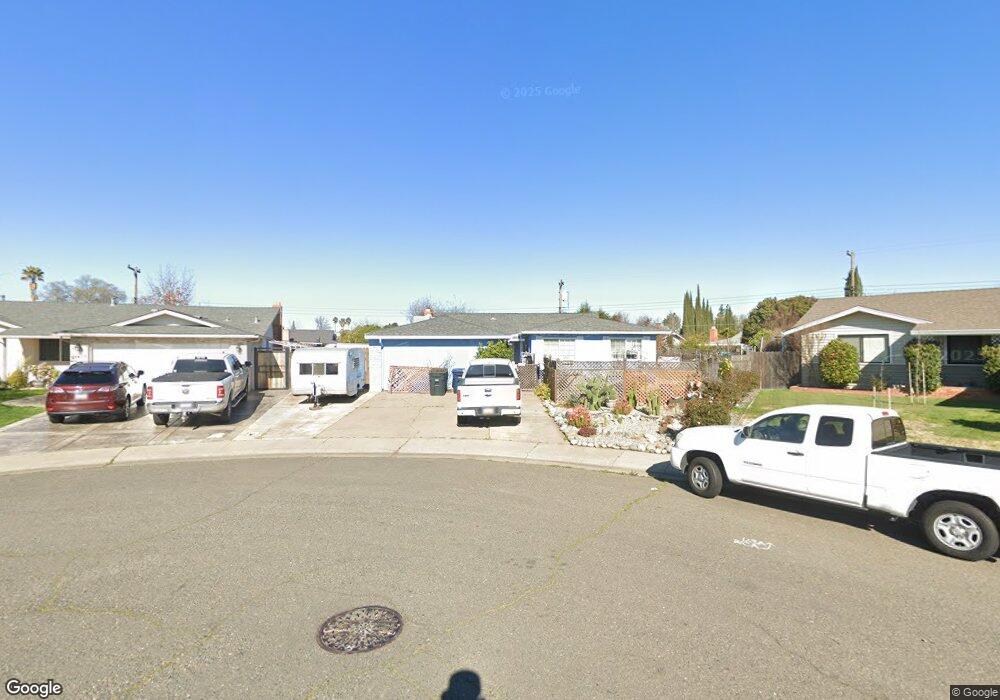
10681 Biscay Way Rancho Cordova, CA 95670
Cordova Lane NeighborhoodEstimated Value: $347,000 - $496,000
3
Beds
2
Baths
1,679
Sq Ft
$261/Sq Ft
Est. Value
About This Home
This home is located at 10681 Biscay Way, Rancho Cordova, CA 95670 and is currently estimated at $438,003, approximately $260 per square foot. 10681 Biscay Way is a home located in Sacramento County with nearby schools including Williamson Elementary School, W.E. Mitchell Middle School, and Cordova High School.
Ownership History
Date
Name
Owned For
Owner Type
Purchase Details
Closed on
Jan 3, 2024
Sold by
Unknown
Bought by
Daniel Lloyd Langford Living Trust and Langford
Current Estimated Value
Purchase Details
Closed on
Jul 13, 2017
Sold by
Langford Tammy Y
Bought by
Langford Daniel L
Purchase Details
Closed on
Apr 24, 1995
Sold by
Moulton Waldo J and Moulton Audrey E
Bought by
Langford Daniel L and Langford Tammy Y
Home Financials for this Owner
Home Financials are based on the most recent Mortgage that was taken out on this home.
Original Mortgage
$115,910
Interest Rate
8.44%
Mortgage Type
FHA
Create a Home Valuation Report for This Property
The Home Valuation Report is an in-depth analysis detailing your home's value as well as a comparison with similar homes in the area
Home Values in the Area
Average Home Value in this Area
Purchase History
| Date | Buyer | Sale Price | Title Company |
|---|---|---|---|
| Daniel Lloyd Langford Living Trust | -- | None Listed On Document | |
| Langford Daniel L | -- | None Available | |
| Langford Daniel L | $117,000 | North American Title Ins Co |
Source: Public Records
Mortgage History
| Date | Status | Borrower | Loan Amount |
|---|---|---|---|
| Previous Owner | Langford Daniel L | $115,910 |
Source: Public Records
Tax History Compared to Growth
Tax History
| Year | Tax Paid | Tax Assessment Tax Assessment Total Assessment is a certain percentage of the fair market value that is determined by local assessors to be the total taxable value of land and additions on the property. | Land | Improvement |
|---|---|---|---|---|
| 2025 | $2,271 | $196,490 | $75,568 | $120,922 |
| 2024 | $2,271 | $192,638 | $74,087 | $118,551 |
| 2023 | $2,224 | $188,862 | $72,635 | $116,227 |
| 2022 | $2,194 | $185,160 | $71,211 | $113,949 |
| 2021 | $2,150 | $181,530 | $69,815 | $111,715 |
| 2020 | $2,135 | $179,670 | $69,100 | $110,570 |
| 2019 | $2,099 | $176,148 | $67,746 | $108,402 |
| 2018 | $2,043 | $172,695 | $66,418 | $106,277 |
| 2017 | $1,990 | $169,310 | $65,116 | $104,194 |
| 2016 | $1,943 | $165,991 | $63,840 | $102,151 |
| 2015 | $1,843 | $163,499 | $62,882 | $100,617 |
| 2014 | $1,961 | $160,298 | $61,651 | $98,647 |
Source: Public Records
Map
Nearby Homes
- 2329 Mcgregor Dr
- 2404 Coolidge Way
- 2413 Cordova Ln
- 2352 Sonata Dr
- 10825 Walnutwood Way
- 2337 Benita Dr
- 2256 Ramo Ct
- 10835 Coloma Rd Unit 3
- 10583 Home Ranch Ct
- 2255 El Manto Dr
- 1977 Benita Dr Unit 1
- 10465 Rugby Ct
- 2129 Danbury Way
- 2200 Kimwood Ln
- 1920 Benita Dr
- 10872 Oakton Way
- 2171 River Vista Way
- 2701 Zinfandel Dr
- 2266 River Trails Cir
- 2746 Aramon Dr
- 10685 Biscay Way
- 10677 Biscay Way
- 10684 Viani Way
- 10678 Viani Way
- 2300 Mcgregor Dr
- 2250 Mcgregor Dr
- 10673 Biscay Way
- 2306 Mcgregor Dr
- 10689 Biscay Way
- 10688 Biscay Way
- 2310 Mcgregor Dr
- 10669 Biscay Way
- 10693 Biscay Way
- 10666 Viani Way
- 10692 Biscay Way
- 2320 Mcgregor Dr
- 10683 Viani Way
- 10691 Viani Way
- 10665 Biscay Way
- 10664 Biscay Way