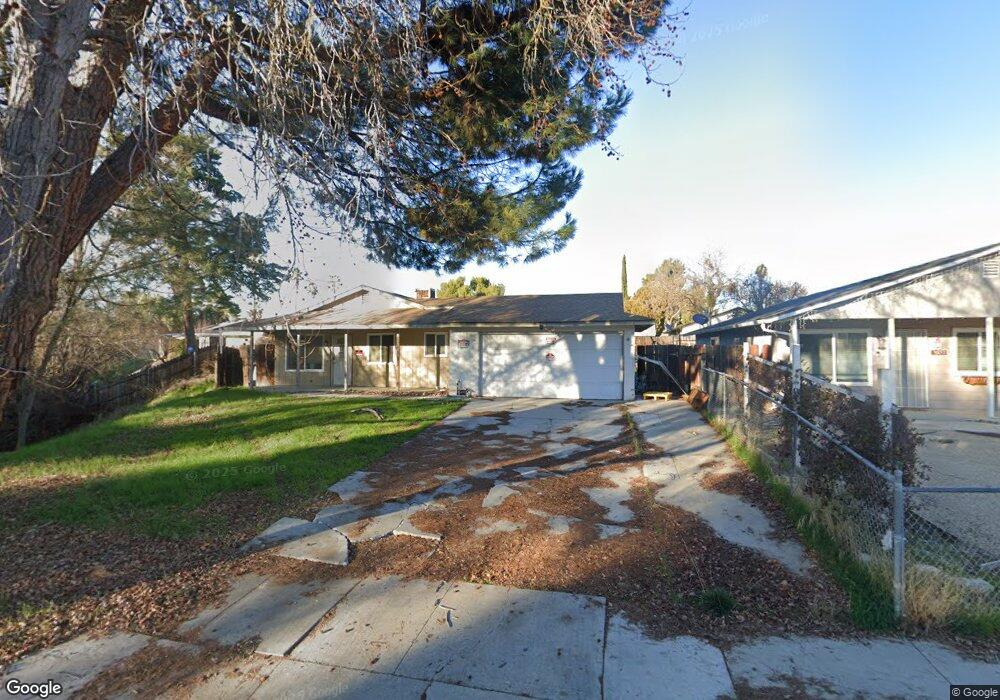
1069 Lana St Paso Robles, CA 93446
Estimated Value: $510,000 - $628,000
3
Beds
2
Baths
1,100
Sq Ft
$526/Sq Ft
Est. Value
About This Home
This home is located at 1069 Lana St, Paso Robles, CA 93446 and is currently estimated at $578,092, approximately $525 per square foot. 1069 Lana St is a home located in San Luis Obispo County with nearby schools including Winifred Pifer Elementary School, Daniel Lewis Middle School, and Paso Robles High School.
Ownership History
Date
Name
Owned For
Owner Type
Purchase Details
Closed on
Oct 10, 2011
Sold by
Lewis Michael R
Bought by
Silva Susan A
Current Estimated Value
Purchase Details
Closed on
Sep 27, 2002
Sold by
Quinn Wendy
Bought by
Rogers James Edward
Purchase Details
Closed on
Sep 24, 2002
Sold by
Rogers James Edward
Bought by
Lewis Michael R and Lewis Susan A Silva
Create a Home Valuation Report for This Property
The Home Valuation Report is an in-depth analysis detailing your home's value as well as a comparison with similar homes in the area
Purchase History
| Date | Buyer | Sale Price | Title Company |
|---|---|---|---|
| Silva Susan A | -- | None Available | |
| Rogers James Edward | -- | Cuesta Title Company | |
| Lewis Michael R | $245,000 | Cuesta Title Company |
Source: Public Records
Tax History
| Year | Tax Paid | Tax Assessment Tax Assessment Total Assessment is a certain percentage of the fair market value that is determined by local assessors to be the total taxable value of land and additions on the property. | Land | Improvement |
|---|---|---|---|---|
| 2025 | $3,867 | $354,816 | $137,577 | $217,239 |
| 2024 | $3,804 | $347,860 | $134,880 | $212,980 |
| 2023 | $3,804 | $341,040 | $132,236 | $208,804 |
| 2022 | $3,748 | $334,354 | $129,644 | $204,710 |
| 2021 | $3,684 | $327,799 | $127,102 | $200,697 |
| 2020 | $3,634 | $324,439 | $125,799 | $198,640 |
| 2019 | $3,582 | $318,079 | $123,333 | $194,746 |
| 2018 | $3,533 | $311,843 | $120,915 | $190,928 |
| 2017 | $3,323 | $305,730 | $118,545 | $187,185 |
| 2016 | $3,257 | $299,736 | $116,221 | $183,515 |
| 2015 | $3,245 | $295,235 | $114,476 | $180,759 |
| 2014 | $3,132 | $289,453 | $112,234 | $177,219 |
Source: Public Records
Map
Nearby Homes
- 1107 Patricia Ln
- 1036 Samantha Dr
- 843 Hacienda Cir
- 845 Creston Rd
- 1020 Par Ave
- 940 Austin Ct
- 827 Marlbank Place
- 225 Lark Dr
- 291 Quail Summit
- 629 Trigo Ln
- 301 Oak Meadow Ln
- 711 Knight Ct
- 4 Dove Ct
- 507 Grand Canyon Dr
- 334 Partridge Ave
- 509 Grand Canyon Dr
- 610 Tucker Ave
- 834 Nicklaus St
- 621 Jackson Dr
- 616 Jackson Dr
Your Personal Tour Guide
Ask me questions while you tour the home.