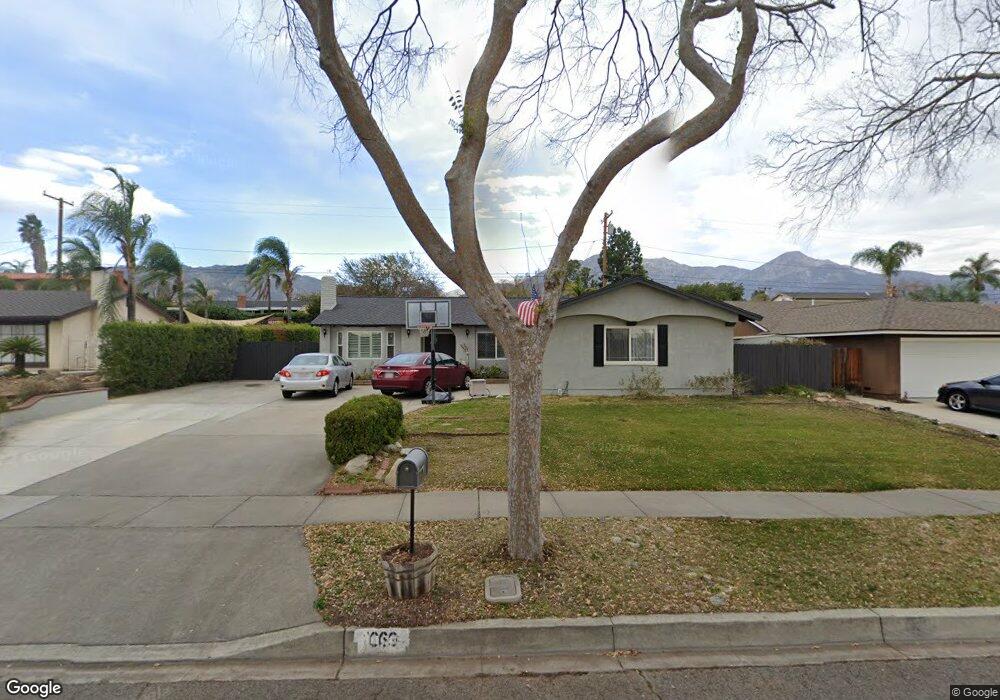
1069 Patrick St Upland, CA 91784
Estimated Value: $739,046 - $852,000
4
Beds
2
Baths
1,450
Sq Ft
$558/Sq Ft
Est. Value
About This Home
This home is located at 1069 Patrick St, Upland, CA 91784 and is currently estimated at $809,262, approximately $558 per square foot. 1069 Patrick St is a home located in San Bernardino County with nearby schools including Pepper Tree Elementary, Pioneer Junior High School, and Upland High School.
Ownership History
Date
Name
Owned For
Owner Type
Purchase Details
Closed on
Apr 28, 2023
Sold by
Torpey Peter A and Torpey Mary Anne
Bought by
Torpey Living Trust
Current Estimated Value
Create a Home Valuation Report for This Property
The Home Valuation Report is an in-depth analysis detailing your home's value as well as a comparison with similar homes in the area
Home Values in the Area
Average Home Value in this Area
Purchase History
| Date | Buyer | Sale Price | Title Company |
|---|---|---|---|
| Torpey Living Trust | -- | None Listed On Document |
Source: Public Records
Tax History
| Year | Tax Paid | Tax Assessment Tax Assessment Total Assessment is a certain percentage of the fair market value that is determined by local assessors to be the total taxable value of land and additions on the property. | Land | Improvement |
|---|---|---|---|---|
| 2025 | $3,509 | $314,764 | $110,167 | $204,597 |
| 2024 | $3,396 | $308,592 | $108,007 | $200,585 |
| 2023 | $3,343 | $302,541 | $105,889 | $196,652 |
| 2022 | $3,269 | $296,609 | $103,813 | $192,796 |
| 2021 | $3,262 | $290,793 | $101,777 | $189,016 |
| 2020 | $3,173 | $287,811 | $100,733 | $187,078 |
| 2019 | $3,161 | $282,168 | $98,758 | $183,410 |
| 2018 | $3,084 | $276,636 | $96,822 | $179,814 |
| 2017 | $2,994 | $271,212 | $94,924 | $176,288 |
| 2016 | $2,798 | $265,894 | $93,063 | $172,831 |
| 2015 | $2,734 | $261,900 | $91,665 | $170,235 |
| 2014 | $2,662 | $256,769 | $89,869 | $166,900 |
Source: Public Records
Map
Nearby Homes
- 1611 N Kelly Ave
- 1613 Erin Ave
- 1691 N Mountain Ave
- 880 El Mirador
- 888 Via Maria
- 860 Calle Del Sol
- 881 Dublin Ct
- 1669 N San Antonio Ave
- 1631 Carmel Cir E
- 1224 Fairway Cir
- 1254 Tamarisk Cir
- 1742 N Albright Ave
- 1540 Palomino Ave
- 1635 Carmel Cir W
- 1672 Carmel Cir W
- 1631 Carmel Cir W
- 635 W 16th St
- 1756 Rosewood Way
- 1580 Lakewood Way
- 1340 Auburn St
- 1057 Patrick St
- 1079 Patrick St
- 1068 Shannon St
- 1058 Shannon St
- 1082 Shannon St
- 1047 Patrick St
- 1089 Patrick St
- 1068 Patrick St
- 1078 Patrick St
- 1046 Shannon St
- 1092 Shannon St
- 1056 Patrick St
- 1090 Patrick St
- 1105 Patrick St
- 1031 Patrick St
- 1046 Patrick St
- 1104 Shannon St
- 1034 Shannon St
- 1100 Patrick St
- 1034 Patrick St
Your Personal Tour Guide
Ask me questions while you tour the home.