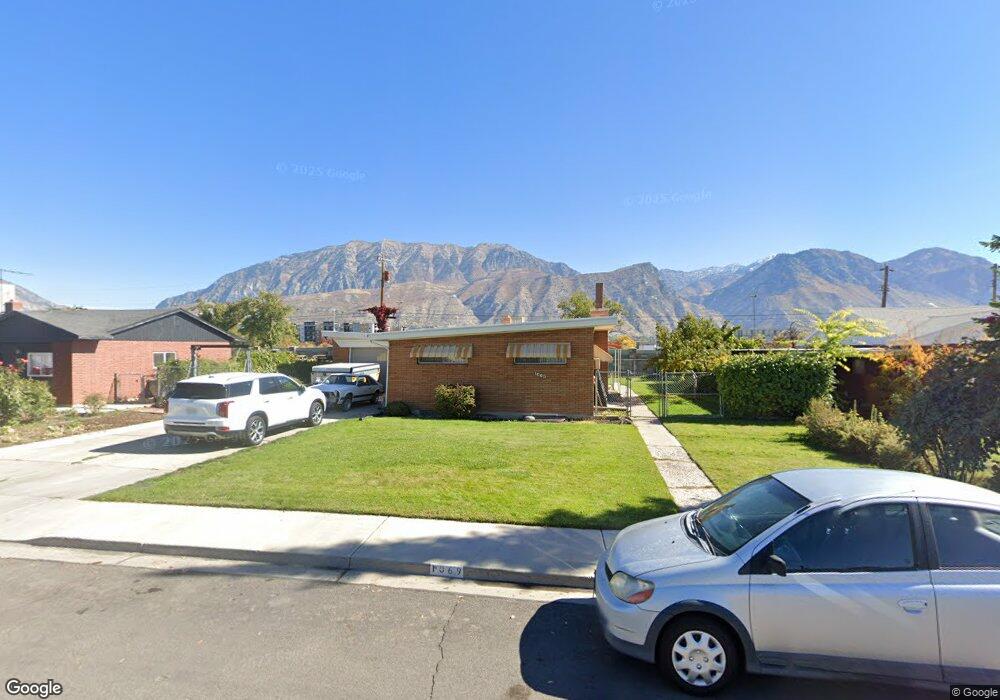
1069 S 545 E Orem, UT 84097
Hillcrest NeighborhoodEstimated Value: $447,000 - $489,000
3
Beds
2
Baths
960
Sq Ft
$492/Sq Ft
Est. Value
About This Home
This home is located at 1069 S 545 E, Orem, UT 84097 and is currently estimated at $472,753, approximately $492 per square foot. 1069 S 545 E is a home located in Utah County with nearby schools including Centennial Elementary, Lakeridge Jr High School, and Orem High School.
Ownership History
Date
Name
Owned For
Owner Type
Purchase Details
Closed on
Jul 10, 2020
Sold by
Crismon Jerry and Crismon Elaine
Bought by
Crismon Elaine H and Crismon Gerald
Current Estimated Value
Home Financials for this Owner
Home Financials are based on the most recent Mortgage that was taken out on this home.
Original Mortgage
$256,000
Outstanding Balance
$224,457
Interest Rate
3.1%
Mortgage Type
New Conventional
Estimated Equity
$248,296
Purchase Details
Closed on
Apr 8, 2015
Sold by
Kasey Enterprises Inc
Bought by
Three Falls Development Inc
Purchase Details
Closed on
Jul 18, 2008
Sold by
Crismon Gerald and Crismon Elaine H
Bought by
Crismon Jerry and Crismon Elaine
Purchase Details
Closed on
Feb 1, 2000
Sold by
Provo City Corp
Bought by
Crismon Motor Company Llc
Create a Home Valuation Report for This Property
The Home Valuation Report is an in-depth analysis detailing your home's value as well as a comparison with similar homes in the area
Home Values in the Area
Average Home Value in this Area
Purchase History
| Date | Buyer | Sale Price | Title Company |
|---|---|---|---|
| Crismon Elaine H | -- | First American Orem | |
| Three Falls Development Inc | -- | Cottonwood Title Ins Ag | |
| Crismon Jerry | -- | None Available | |
| Crismon Motor Company Llc | -- | -- |
Source: Public Records
Mortgage History
| Date | Status | Borrower | Loan Amount |
|---|---|---|---|
| Open | Crismon Elaine H | $256,000 |
Source: Public Records
Tax History
| Year | Tax Paid | Tax Assessment Tax Assessment Total Assessment is a certain percentage of the fair market value that is determined by local assessors to be the total taxable value of land and additions on the property. | Land | Improvement |
|---|---|---|---|---|
| 2025 | $1,931 | $247,500 | -- | -- |
| 2024 | $1,931 | $236,060 | $0 | $0 |
| 2023 | $1,801 | $236,720 | $0 | $0 |
| 2022 | $1,767 | $225,005 | $0 | $0 |
| 2021 | $1,595 | $307,500 | $124,100 | $183,400 |
| 2020 | $1,464 | $277,400 | $99,300 | $178,100 |
| 2019 | $1,290 | $254,200 | $99,300 | $154,900 |
| 2018 | $1,226 | $230,800 | $92,200 | $138,600 |
| 2017 | $1,155 | $116,490 | $0 | $0 |
| 2016 | $1,107 | $102,960 | $0 | $0 |
| 2015 | $1,133 | $99,660 | $0 | $0 |
| 2014 | $1,077 | $94,325 | $0 | $0 |
Source: Public Records
Map
Nearby Homes
Your Personal Tour Guide
Ask me questions while you tour the home.