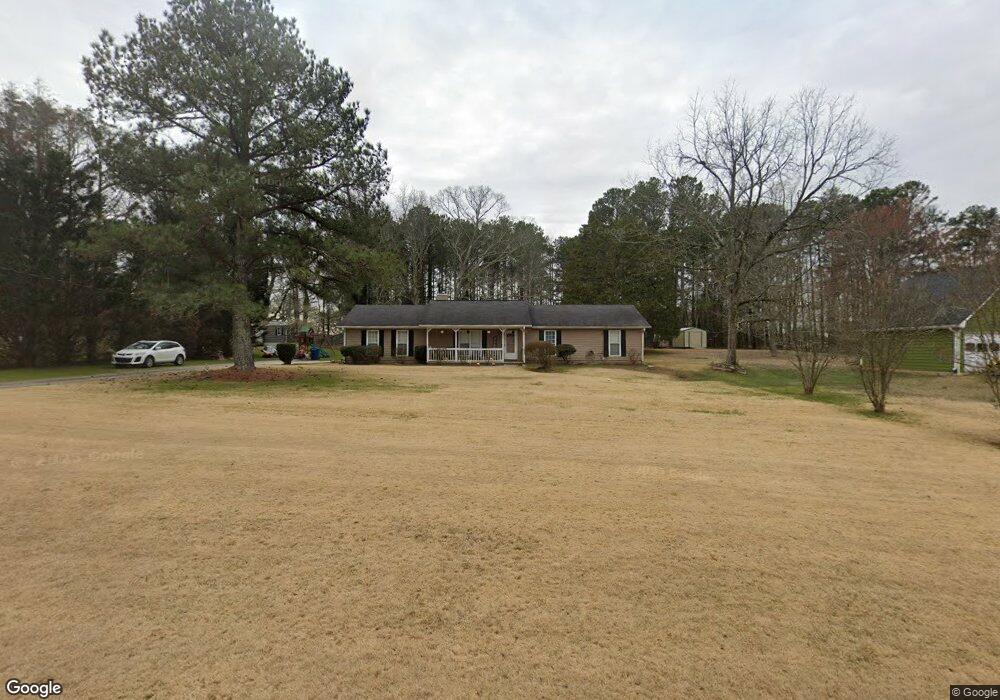
107 Black Oak Ct Unit 1 Stockbridge, GA 30281
Estimated Value: $244,057 - $277,000
3
Beds
2
Baths
1,604
Sq Ft
$160/Sq Ft
Est. Value
About This Home
This home is located at 107 Black Oak Ct Unit 1, Stockbridge, GA 30281 and is currently estimated at $256,764, approximately $160 per square foot. 107 Black Oak Ct Unit 1 is a home located in Henry County with nearby schools including Fairview Elementary School, Austin Road Middle School, and Stockbridge High School.
Ownership History
Date
Name
Owned For
Owner Type
Purchase Details
Closed on
Oct 19, 2020
Sold by
Thompson Shanon J
Bought by
Harden Sierra N
Current Estimated Value
Home Financials for this Owner
Home Financials are based on the most recent Mortgage that was taken out on this home.
Original Mortgage
$162,011
Outstanding Balance
$142,990
Interest Rate
2.8%
Mortgage Type
FHA
Estimated Equity
$113,774
Purchase Details
Closed on
Feb 4, 2000
Sold by
Cabranes-Martinez Casimiro
Bought by
Stephens Shannon J
Home Financials for this Owner
Home Financials are based on the most recent Mortgage that was taken out on this home.
Original Mortgage
$102,614
Interest Rate
8.17%
Mortgage Type
FHA
Create a Home Valuation Report for This Property
The Home Valuation Report is an in-depth analysis detailing your home's value as well as a comparison with similar homes in the area
Home Values in the Area
Average Home Value in this Area
Purchase History
| Date | Buyer | Sale Price | Title Company |
|---|---|---|---|
| Harden Sierra N | $165,000 | -- | |
| Stephens Shannon J | $104,000 | -- |
Source: Public Records
Mortgage History
| Date | Status | Borrower | Loan Amount |
|---|---|---|---|
| Open | Harden Sierra N | $162,011 | |
| Previous Owner | Stephens Shannon J | $102,614 |
Source: Public Records
Tax History Compared to Growth
Tax History
| Year | Tax Paid | Tax Assessment Tax Assessment Total Assessment is a certain percentage of the fair market value that is determined by local assessors to be the total taxable value of land and additions on the property. | Land | Improvement |
|---|---|---|---|---|
| 2025 | $4,237 | $106,160 | $18,000 | $88,160 |
| 2024 | $4,237 | $111,760 | $18,000 | $93,760 |
| 2023 | $3,630 | $93,600 | $10,000 | $83,600 |
| 2022 | $3,104 | $79,880 | $10,000 | $69,880 |
| 2021 | $2,546 | $65,320 | $10,000 | $55,320 |
| 2020 | $1,713 | $53,400 | $8,000 | $45,400 |
| 2019 | $1,586 | $48,040 | $8,000 | $40,040 |
| 2018 | $1,503 | $45,200 | $8,000 | $37,200 |
| 2016 | $1,251 | $38,640 | $7,200 | $31,440 |
| 2015 | $925 | $29,680 | $5,200 | $24,480 |
| 2014 | $866 | $28,000 | $5,200 | $22,800 |
Source: Public Records
Map
Nearby Homes
- 208 Pauline Place
- 313 Ashborough Place
- 2132 E Atlanta Rd
- 204 Benefield Ct
- 40 Lake Ct
- 907 Strawberry Ct
- 963 Blackberry Ct
- 500 Saint Sambar Dr
- 491 Thurman Rd Unit TRACT C
- 565 Scarborough Rd
- 429 Saint Surrey Way
- 145 Glenloch Pkwy
- 565 Patillo Rd
- 160 Chapel Ridge Dr
- 1414 Panola Rd
- 168 Chapel Ridge Dr
- 444 Cauthen Ct
- 5478 Flakes Mill Rd
- 1773 E Atlanta Rd
- 115 Belmont Farms Dr
- 109 Black Oak Ct Unit 1
- 105 Black Oak Ct
- 105 Black Oak Ct Unit 1
- 0 Black Oak Ct Unit 7374698
- 0 Black Oak Ct Unit 8592619
- 0 Black Oak Ct Unit 8161917
- 0 Black Oak Ct Unit 7584266
- 0 Black Oak Ct Unit 3185236
- 0 Black Oak Ct
- 111 Black Oak Ct
- 595 Fairview Rd
- 103 Black Oak Ct
- 103 Black Oak Ct Unit 1
- 110 Black Oak Ct Unit 1
- 112 Black Oak Ct Unit 1
- 113 Black Oak Ct
- 200 Sweetgum Ln
- 200 Sweetgum Ln
- 108 Black Oak Ct
- 114 Black Oak Ct