Estimated Value: $1,025,000 - $1,275,000
3
Beds
3
Baths
1,734
Sq Ft
$643/Sq Ft
Est. Value
About This Home
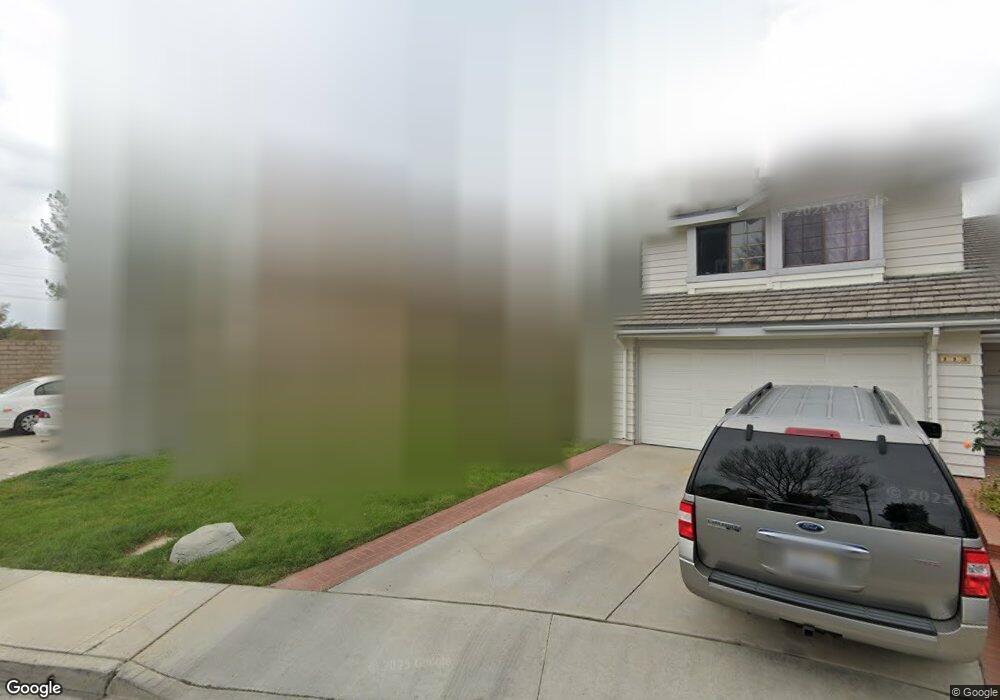
This home is located at 107 Donnybrook Rd, Brea, CA 92821 and is currently estimated at $1,115,495, approximately $643 per square foot. 107 Donnybrook Rd is a home located in Orange County with nearby schools including Brea Country Hills Elementary School, Brea Junior High School, and Brea-Olinda High School.
Ownership History
Date
Name
Owned For
Owner Type
Purchase Details
Closed on
Aug 15, 2001
Sold by
Palombi Shannon
Bought by
Palombi Randolph M
Current Estimated Value
Home Financials for this Owner
Home Financials are based on the most recent Mortgage that was taken out on this home.
Original Mortgage
$273,600
Outstanding Balance
$104,874
Interest Rate
6.91%
Estimated Equity
$1,010,621
Purchase Details
Closed on
Aug 14, 2001
Sold by
Palombi Randolph M
Bought by
Long Stephen B and Schoenig Theresa J
Home Financials for this Owner
Home Financials are based on the most recent Mortgage that was taken out on this home.
Original Mortgage
$273,600
Outstanding Balance
$104,874
Interest Rate
6.91%
Estimated Equity
$1,010,621
Purchase Details
Closed on
Sep 20, 1993
Sold by
Bush Kevin R and Bush Jeanine A
Bought by
Palombi Randolph M
Home Financials for this Owner
Home Financials are based on the most recent Mortgage that was taken out on this home.
Original Mortgage
$181,200
Interest Rate
6.97%
Create a Home Valuation Report for This Property
The Home Valuation Report is an in-depth analysis detailing your home's value as well as a comparison with similar homes in the area
Home Values in the Area
Average Home Value in this Area
Purchase History
| Date | Buyer | Sale Price | Title Company |
|---|---|---|---|
| Palombi Randolph M | -- | -- | |
| Long Stephen B | $342,000 | -- | |
| Palombi Randolph M | $226,500 | Orange Coast Title |
Source: Public Records
Mortgage History
| Date | Status | Borrower | Loan Amount |
|---|---|---|---|
| Open | Long Stephen B | $273,600 | |
| Previous Owner | Palombi Randolph M | $181,200 | |
| Closed | Long Stephen B | $34,200 |
Source: Public Records
Tax History
| Year | Tax Paid | Tax Assessment Tax Assessment Total Assessment is a certain percentage of the fair market value that is determined by local assessors to be the total taxable value of land and additions on the property. | Land | Improvement |
|---|---|---|---|---|
| 2025 | $5,833 | $505,227 | $303,094 | $202,133 |
| 2024 | $5,833 | $495,321 | $297,151 | $198,170 |
| 2023 | $5,672 | $485,609 | $291,324 | $194,285 |
| 2022 | $5,618 | $476,088 | $285,612 | $190,476 |
| 2021 | $5,514 | $466,753 | $280,011 | $186,742 |
| 2020 | $5,477 | $461,968 | $277,140 | $184,828 |
| 2019 | $5,332 | $452,910 | $271,706 | $181,204 |
| 2018 | $5,253 | $444,030 | $266,379 | $177,651 |
| 2017 | $5,155 | $435,324 | $261,156 | $174,168 |
| 2016 | $5,054 | $426,789 | $256,036 | $170,753 |
| 2015 | $4,984 | $420,379 | $252,190 | $168,189 |
| 2014 | $4,841 | $412,145 | $247,250 | $164,895 |
Source: Public Records
Map
Nearby Homes
- 2050 Fallingleaf Cir
- 2304 Carrotwood Dr
- 2363 Morning Dew Dr
- 1796 Ravencrest Dr
- 2583 Sandpebble Ln
- 2488 E Kern River Ln
- 2761 E Stearns St
- 688 Buttonwood Dr
- 2851 Rolling Hills Dr Unit 257
- 2851 Rolling Hills Dr Unit 248
- 2851 Rolling Hills Dr
- 648 Pepperwood Dr
- 149 Bluegrass St
- 2498 E Santa Paula Dr
- 360 Meadow Ct
- 3016 Clearwood Ct
- 213 Appalachian Cir
- 329 Surry Ct
- 500 Silver Canyon Way
- 3054 Associated Rd Unit 20
- 113 Donnybrook Rd
- 119 Donnybrook Rd
- 110 Morningflower Cir
- 104 Morningflower Cir
- 116 Morningflower Cir
- 100 Donnybrook Rd
- 112 Donnybrook Rd
- 118 Donnybrook Rd
- 106 Donnybrook Rd
- 126 Donnybrook Rd
- 130 Donnybrook Rd
- 105 Morningflower Cir
- 136 Donnybrook Rd
- 1919 E Birch St
- 1919 E Birch St
- 111 Morningflower Cir
- 117 Morningflower Cir
- 2002 Whispering Glen Ln
- 1992 Whispering Glen Ln
- 1984 Whispering Glen Ln
Your Personal Tour Guide
Ask me questions while you tour the home.