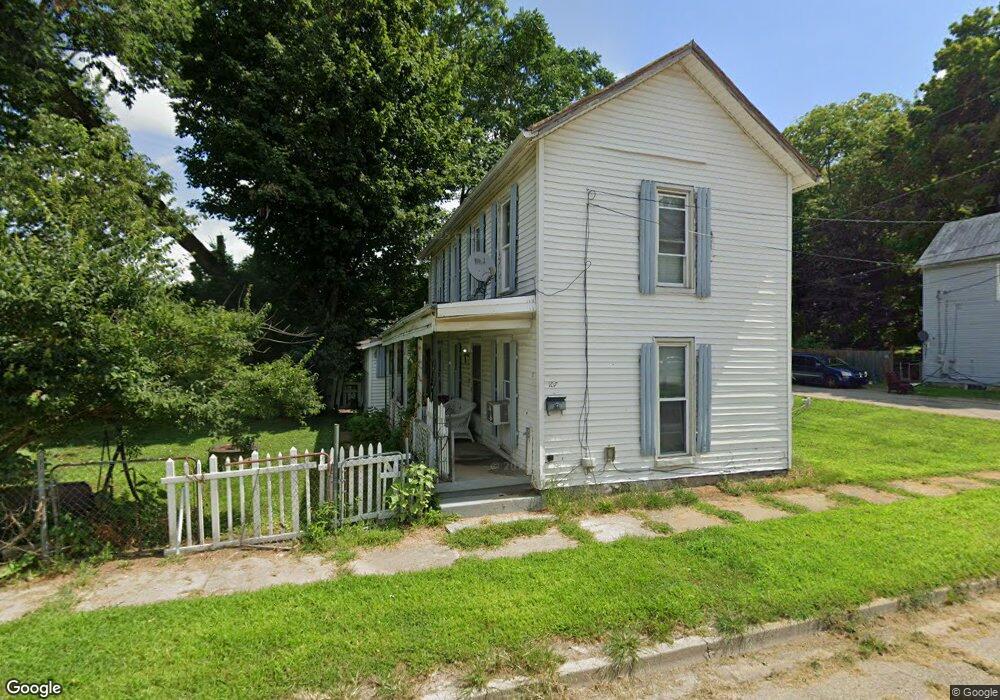
107 E 5th St Franklin, OH 45005
Estimated Value: $116,000 - $157,000
2
Beds
1
Bath
1,204
Sq Ft
$109/Sq Ft
Est. Value
About This Home
This home is located at 107 E 5th St, Franklin, OH 45005 and is currently estimated at $131,391, approximately $109 per square foot. 107 E 5th St is a home located in Warren County with nearby schools including Franklin High School.
Ownership History
Date
Name
Owned For
Owner Type
Purchase Details
Closed on
Oct 23, 2008
Sold by
Novastar Mortgage Inc
Bought by
Broughton Garrett
Current Estimated Value
Purchase Details
Closed on
May 15, 2008
Sold by
Courtney Sadara J and Case #07Cv69612
Bought by
Novastar Mortgage Inc
Purchase Details
Closed on
Feb 23, 2007
Sold by
Rosebrook Arnette M
Bought by
Courtney Sadara J
Purchase Details
Closed on
Jul 29, 2005
Sold by
Letson Linda and Letson James D
Bought by
Courtney Sadara J and Rosebrook Arnette M
Home Financials for this Owner
Home Financials are based on the most recent Mortgage that was taken out on this home.
Original Mortgage
$59,900
Interest Rate
8.85%
Mortgage Type
Fannie Mae Freddie Mac
Purchase Details
Closed on
Apr 24, 1985
Sold by
Young Young and Young Anna Mae
Bought by
Raleigh Hollon and Raleigh E.
Purchase Details
Closed on
Apr 12, 1984
Sold by
Young Bradley and Young Bradley
Bought by
Young and Anna Mae
Create a Home Valuation Report for This Property
The Home Valuation Report is an in-depth analysis detailing your home's value as well as a comparison with similar homes in the area
Home Values in the Area
Average Home Value in this Area
Purchase History
| Date | Buyer | Sale Price | Title Company |
|---|---|---|---|
| Broughton Garrett | $13,500 | Fidelity Land Title | |
| Novastar Mortgage Inc | $33,334 | None Available | |
| Courtney Sadara J | -- | Attorney | |
| Courtney Sadara J | $59,900 | Mid America Land Title | |
| Raleigh Hollon | -- | -- | |
| Young | -- | -- |
Source: Public Records
Mortgage History
| Date | Status | Borrower | Loan Amount |
|---|---|---|---|
| Previous Owner | Courtney Sadara J | $59,900 |
Source: Public Records
Tax History
| Year | Tax Paid | Tax Assessment Tax Assessment Total Assessment is a certain percentage of the fair market value that is determined by local assessors to be the total taxable value of land and additions on the property. | Land | Improvement |
|---|---|---|---|---|
| 2025 | $1,020 | $21,210 | $7,670 | $13,540 |
| 2024 | $1,020 | $21,210 | $7,670 | $13,540 |
| 2023 | $825 | $15,382 | $4,350 | $11,032 |
| 2022 | $1,280 | $15,383 | $4,351 | $11,032 |
| 2021 | $766 | $15,383 | $4,351 | $11,032 |
| 2020 | $689 | $12,205 | $3,451 | $8,754 |
| 2019 | $628 | $12,205 | $3,451 | $8,754 |
| 2018 | $620 | $12,205 | $3,451 | $8,754 |
| 2017 | $651 | $11,554 | $3,315 | $8,239 |
| 2016 | $664 | $11,554 | $3,315 | $8,239 |
| 2015 | $332 | $11,554 | $3,315 | $8,239 |
| 2014 | $672 | $11,550 | $3,310 | $8,240 |
| 2013 | $580 | $13,370 | $3,840 | $9,530 |
Source: Public Records
Map
Nearby Homes