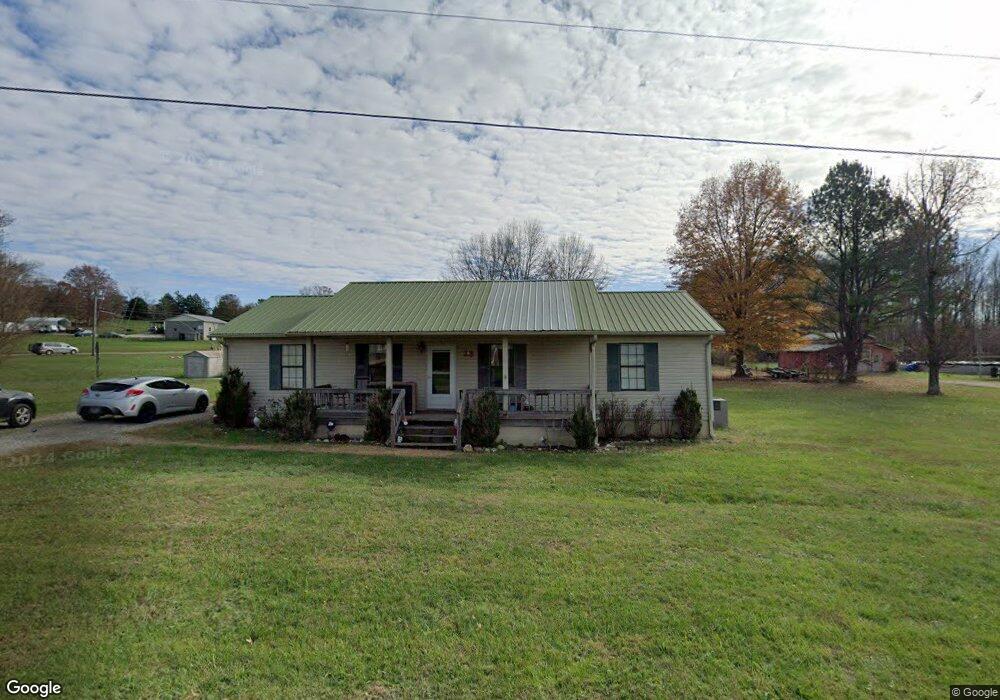
107 Little Ln Cookeville, TN 38506
Estimated Value: $79,000 - $272,000
3
Beds
2
Baths
1,300
Sq Ft
$142/Sq Ft
Est. Value
About This Home
This home is located at 107 Little Ln, Cookeville, TN 38506 and is currently estimated at $184,291, approximately $141 per square foot. 107 Little Ln is a home located in Overton County.
Ownership History
Date
Name
Owned For
Owner Type
Purchase Details
Closed on
Oct 21, 2024
Sold by
Smith Jody Lynn and Wilson Ronnie
Bought by
Ray Gregory
Current Estimated Value
Home Financials for this Owner
Home Financials are based on the most recent Mortgage that was taken out on this home.
Original Mortgage
$92,500
Outstanding Balance
$91,500
Interest Rate
6.2%
Mortgage Type
New Conventional
Estimated Equity
$92,791
Purchase Details
Closed on
Dec 15, 2014
Sold by
Ray Marie
Bought by
Ray Gregory and Wilson Ronnie
Purchase Details
Closed on
Jul 1, 2014
Sold by
Ray Marie
Bought by
Ray Marie - Le Rem and Ray Gregory Ray
Purchase Details
Closed on
Nov 26, 2013
Sold by
Payne Brian K
Bought by
Ray Marie
Purchase Details
Closed on
Sep 3, 2010
Sold by
The Bank Of New York Mello
Bought by
Payne Brian K
Purchase Details
Closed on
Jan 14, 2010
Sold by
Smith Brian L
Bought by
The Bank Of New York Mellon
Purchase Details
Closed on
Jul 16, 1996
Bought by
Smith Brian L and Smith Joanna
Create a Home Valuation Report for This Property
The Home Valuation Report is an in-depth analysis detailing your home's value as well as a comparison with similar homes in the area
Home Values in the Area
Average Home Value in this Area
Purchase History
| Date | Buyer | Sale Price | Title Company |
|---|---|---|---|
| Ray Gregory | $82,500 | None Listed On Document | |
| Ray Gregory | $82,500 | None Listed On Document | |
| Ray Gregory | -- | -- | |
| Ray Marie - Le Rem | -- | -- | |
| Ray Marie | $80,000 | -- | |
| Payne Brian K | $51,000 | -- | |
| The Bank Of New York Mellon | $40,788 | -- | |
| Smith Brian L | $57,900 | -- |
Source: Public Records
Mortgage History
| Date | Status | Borrower | Loan Amount |
|---|---|---|---|
| Open | Ray Gregory | $92,500 | |
| Closed | Ray Gregory | $92,500 |
Source: Public Records
Tax History Compared to Growth
Tax History
| Year | Tax Paid | Tax Assessment Tax Assessment Total Assessment is a certain percentage of the fair market value that is determined by local assessors to be the total taxable value of land and additions on the property. | Land | Improvement |
|---|---|---|---|---|
| 2024 | $521 | $23,175 | $1,875 | $21,300 |
| 2023 | $457 | $23,175 | $1,875 | $21,300 |
| 2022 | $457 | $23,175 | $1,875 | $21,300 |
| 2021 | $457 | $23,175 | $1,875 | $21,300 |
| 2020 | $457 | $23,175 | $1,875 | $21,300 |
| 2019 | $436 | $19,375 | $1,725 | $17,650 |
| 2018 | $436 | $19,375 | $1,725 | $17,650 |
| 2017 | $423 | $18,800 | $1,725 | $17,075 |
| 2016 | $423 | $18,800 | $1,725 | $17,075 |
| 2015 | $374 | $18,800 | $1,725 | $17,075 |
| 2014 | -- | $18,800 | $1,725 | $17,075 |
| 2013 | -- | $21,275 | $0 | $0 |
Source: Public Records
Map
Nearby Homes
- 738 Blue Water Dr
- 139 June Chapel Rd
- 245 Crooked Creek Dr
- 820 Country Wood Ct
- 395 Old Oak Hill Rd
- 673 Rickman Monterey Hwy
- 352 Rickman Monterey Hwy
- 1 Bilbrey Rd
- 00 Milk Barn Ln
- 0 Overlook Cir
- 21.40 AC Overlook Cir
- 235 Rickman Monterey Hwy
- 30 AC W Paron Rd
- 204 Rickman Monterey Hwy
- 144 Rickman Community Center Rd
- 500 Walnut Heights Ln
- 900 Brotherton Dr
- 1080 Brotherton Dr
- 8516 Spring Creek Rd
- 8512 Spring Creek Rd
- 115 Little Ln
- 0 Spring Creek Rd Unit 623359
- 25 AC Spring Creek Rd
- 1680 Spring Creek Rd
- 8580 Spring Creek Rd
- 00 Spring Creek Rd
- 16.43 AC Spring Creek Rd
- 4.06 AC Spring Creek Rd
- 41 AC Little Ln
- 8518 Spring Creek Rd
- 121 Little Ln
- 122 Little Ln
- 8528 Spring Creek Rd
- 8312 Spring Creek Rd
- 107 Cozine Ln
- 126 Little Ln
- 426 June Chapel Rd
- 156 Thorne Ln