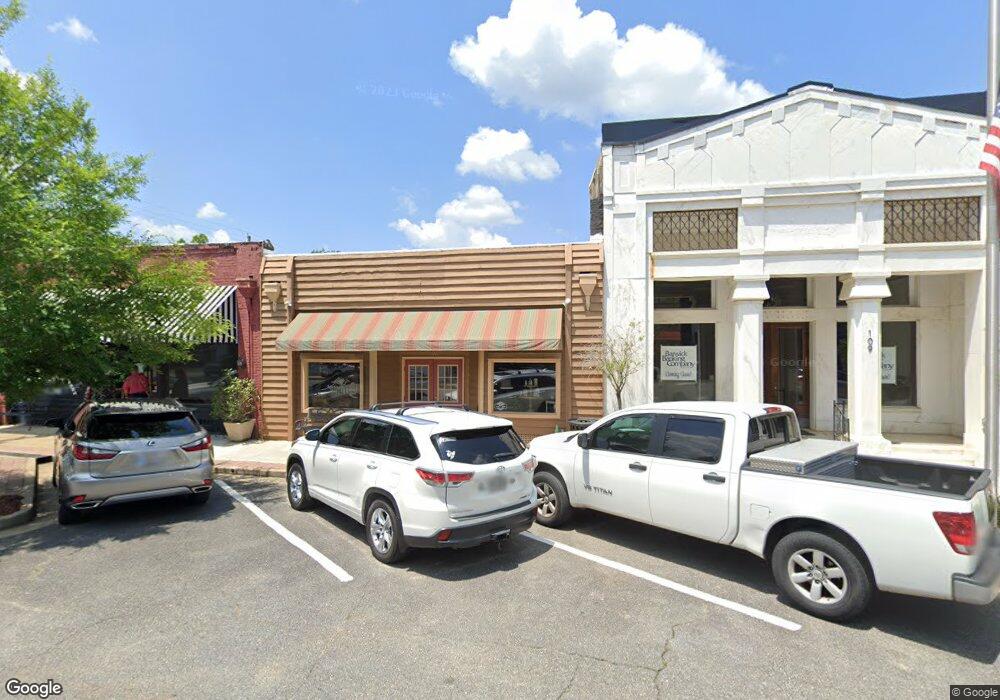
107 N Main St Boston, GA 31626
Estimated Value: $130,352
--
Bed
1
Bath
2,100
Sq Ft
$62/Sq Ft
Est. Value
About This Home
This home is located at 107 N Main St, Boston, GA 31626 and is currently estimated at $130,352, approximately $62 per square foot. 107 N Main St is a home located in Thomas County with nearby schools including Hand in Hand Primary School, Garrison-Pilcher Elementary School, and Cross Creek Elementary School.
Ownership History
Date
Name
Owned For
Owner Type
Purchase Details
Closed on
Feb 16, 2017
Sold by
Collins Walter Ronald
Bought by
Booker Phillip Randall
Current Estimated Value
Purchase Details
Closed on
Oct 25, 2013
Sold by
Hutchison Robert C
Bought by
Collins Terina Lori
Home Financials for this Owner
Home Financials are based on the most recent Mortgage that was taken out on this home.
Original Mortgage
$40,000
Interest Rate
4.33%
Mortgage Type
Commercial
Purchase Details
Closed on
Feb 6, 2006
Sold by
Newton Elsie C
Bought by
Hutchison Robert C and Hutchison Lynn H
Home Financials for this Owner
Home Financials are based on the most recent Mortgage that was taken out on this home.
Original Mortgage
$50,250
Interest Rate
6.14%
Mortgage Type
Commercial
Purchase Details
Closed on
Mar 17, 1994
Bought by
Newton R Don
Create a Home Valuation Report for This Property
The Home Valuation Report is an in-depth analysis detailing your home's value as well as a comparison with similar homes in the area
Home Values in the Area
Average Home Value in this Area
Purchase History
| Date | Buyer | Sale Price | Title Company |
|---|---|---|---|
| Booker Phillip Randall | $62,775 | -- | |
| Collins Terina Lori | $50,000 | -- | |
| Hutchison Robert C | $12,000 | -- | |
| Newton R Don | -- | -- |
Source: Public Records
Mortgage History
| Date | Status | Borrower | Loan Amount |
|---|---|---|---|
| Previous Owner | Collins Terina Lori | $40,000 | |
| Previous Owner | Hutchison Robert C | $50,250 |
Source: Public Records
Tax History Compared to Growth
Tax History
| Year | Tax Paid | Tax Assessment Tax Assessment Total Assessment is a certain percentage of the fair market value that is determined by local assessors to be the total taxable value of land and additions on the property. | Land | Improvement |
|---|---|---|---|---|
| 2024 | $709 | $21,970 | $1,046 | $20,924 |
| 2023 | $697 | $21,913 | $1,046 | $20,867 |
| 2022 | $479 | $19,956 | $1,046 | $18,910 |
| 2021 | $523 | $19,822 | $1,045 | $18,777 |
| 2020 | $585 | $21,681 | $1,046 | $20,635 |
| 2019 | $589 | $21,681 | $1,046 | $20,635 |
| 2018 | $650 | $23,745 | $1,046 | $22,699 |
| 2017 | $717 | $25,808 | $1,046 | $24,762 |
| 2016 | $952 | $40,216 | $1,046 | $39,170 |
| 2015 | $960 | $34,156 | $1,046 | $33,110 |
| 2014 | $566 | $34,156 | $1,046 | $33,110 |
| 2013 | -- | $34,155 | $1,045 | $33,110 |
Source: Public Records
Map
Nearby Homes
- 130 E Adams St
- 682 Salem Rd
- 146 Old Highway 84 W
- 185 Community Ln
- 2815 Parker Rd
- 9900 Ozell Rd
- 4311 Ozell Rd
- 431 Dry Lake Rd
- 00 Summer Hill Rd Unit 1
- 2156 County Road 78
- 842 Crabapple Dr
- 2818 Dry Lake Rd
- 7402 Coffee Rd
- 00 Cone Road & Beulah Church Rd
- 454 Fox Meadow Ln
- 233 Fox Meadow Ln
- 138
- 0 Spencer Rd
- 313 Summer Meadows Dr
- 7500 U S 19
- 105 N Main St
- 110 N Main St
- 104 N Main St
- 420 Boles Rd
- 109 W Jefferson St
- 119 N Main St
- 114 N Main St
- 110 Bn S Main
- Lot 7 S Main St
- Lot 6 S Main St
- 116 Sioux St
- 126 Pear St
- 123 S Main St Unit BN
- 113 S Norton St
- Lot 5 S Main St
- 203 W Jefferson St
- 116 W Railroad Ave
- 214 W Jefferson St
- 121 S Norton St
- 112 S Stephens St