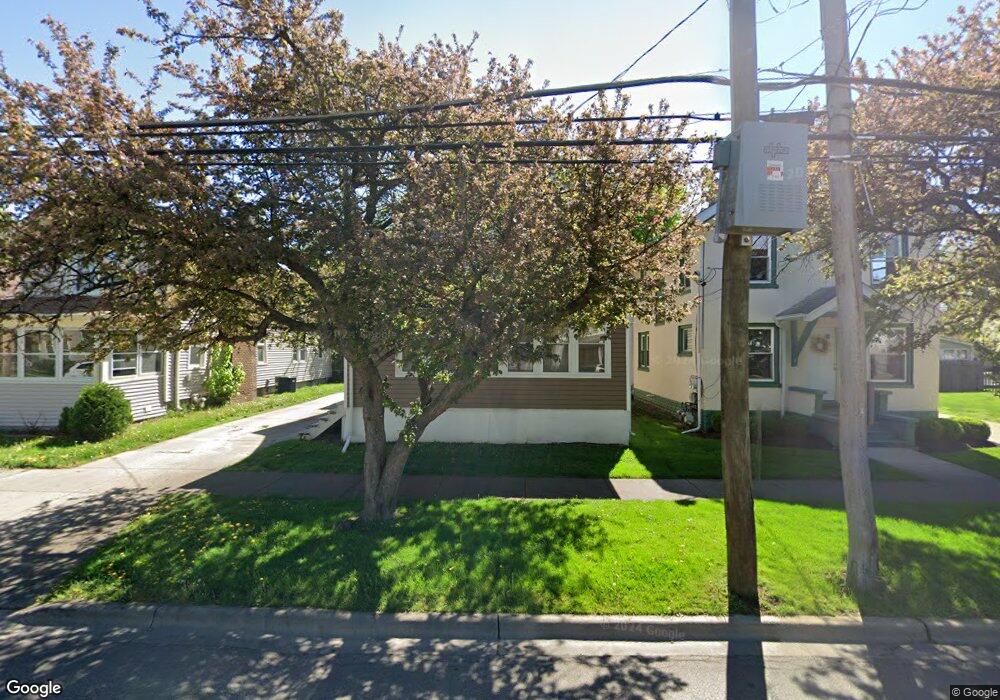
107 N Union St Aurora, IL 60505
McCarty Burlington NeighborhoodEstimated Value: $214,000 - $252,000
3
Beds
1
Bath
1,369
Sq Ft
$172/Sq Ft
Est. Value
About This Home
This home is located at 107 N Union St, Aurora, IL 60505 and is currently estimated at $235,139, approximately $171 per square foot. 107 N Union St is a home located in Kane County with nearby schools including Edna Rollins Elementary School, Simmons Middle School, and East Aurora High School.
Ownership History
Date
Name
Owned For
Owner Type
Purchase Details
Closed on
Oct 15, 2025
Sold by
Lopez Martin Garcia
Bought by
Rosas Erika Nogales
Current Estimated Value
Purchase Details
Closed on
Dec 11, 2014
Sold by
Lopez Ernesto and Lopez Mineo Clelia R
Bought by
Garcia Lopez Martin and Nogales Rosas Erika
Purchase Details
Closed on
Jun 12, 2012
Sold by
Zamudio Gloria A and Lopez Mineo Clelia R
Bought by
Lopez Ernesto and Lopez Mineo Clelia R
Create a Home Valuation Report for This Property
The Home Valuation Report is an in-depth analysis detailing your home's value as well as a comparison with similar homes in the area
Home Values in the Area
Average Home Value in this Area
Purchase History
| Date | Buyer | Sale Price | Title Company |
|---|---|---|---|
| Rosas Erika Nogales | -- | None Listed On Document | |
| Garcia Lopez Martin | $48,000 | None Available | |
| Lopez Ernesto | -- | None Available |
Source: Public Records
Tax History Compared to Growth
Tax History
| Year | Tax Paid | Tax Assessment Tax Assessment Total Assessment is a certain percentage of the fair market value that is determined by local assessors to be the total taxable value of land and additions on the property. | Land | Improvement |
|---|---|---|---|---|
| 2024 | $3,361 | $57,025 | $5,477 | $51,548 |
| 2023 | $3,210 | $50,952 | $4,894 | $46,058 |
| 2022 | $3,076 | $46,489 | $4,465 | $42,024 |
| 2021 | $3,010 | $43,282 | $4,157 | $39,125 |
| 2020 | $2,844 | $40,202 | $3,861 | $36,341 |
| 2019 | $3,167 | $41,946 | $3,577 | $38,369 |
| 2018 | $2,913 | $37,877 | $3,309 | $34,568 |
| 2017 | $2,626 | $32,775 | $3,049 | $29,726 |
| 2016 | $2,316 | $28,013 | $2,614 | $25,399 |
| 2015 | -- | $26,013 | $2,248 | $23,765 |
| 2014 | -- | $24,034 | $2,066 | $21,968 |
| 2013 | -- | $28,141 | $1,974 | $26,167 |
Source: Public Records
Map
Nearby Homes