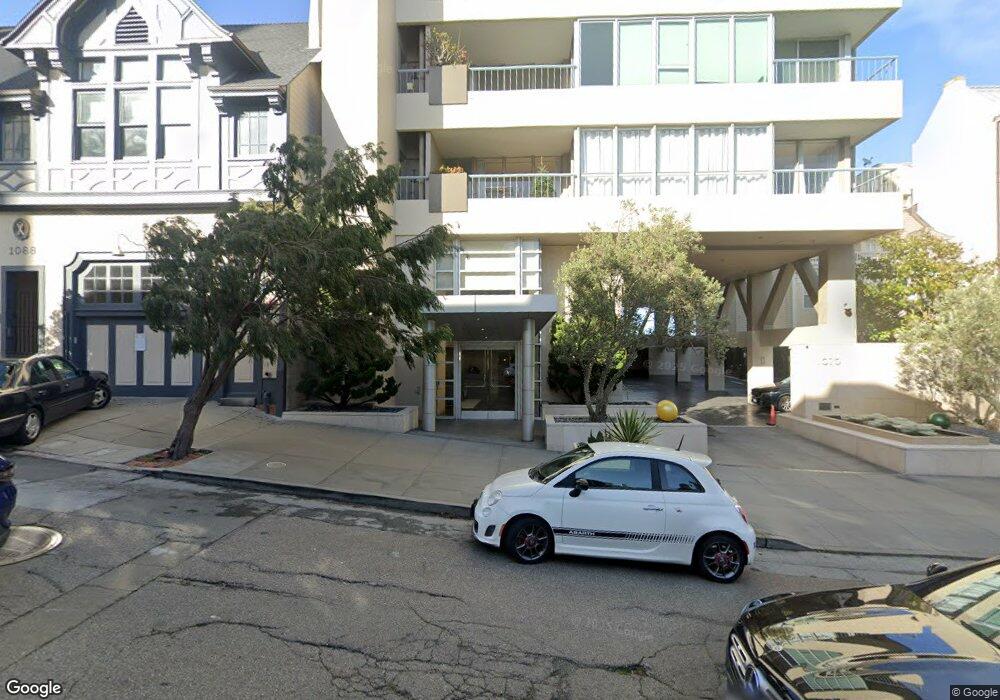
1070 Green St Unit 1900 San Francisco, CA 94133
Russian Hill NeighborhoodEstimated Value: $4,371,000 - $6,886,325
3
Beds
4
Baths
4,207
Sq Ft
$1,260/Sq Ft
Est. Value
About This Home
This home is located at 1070 Green St Unit 1900, San Francisco, CA 94133 and is currently estimated at $5,302,442, approximately $1,260 per square foot. 1070 Green St Unit 1900 is a home located in San Francisco County with nearby schools including Yick Wo Elementary School, Francisco Middle School, and Cathedral School for Boys.
Ownership History
Date
Name
Owned For
Owner Type
Purchase Details
Closed on
Jul 13, 2009
Sold by
Corash Laurence and Corash Michele B
Bought by
Corash Laurence and Corash Michele B
Current Estimated Value
Home Financials for this Owner
Home Financials are based on the most recent Mortgage that was taken out on this home.
Original Mortgage
$1,100,000
Outstanding Balance
$621,469
Interest Rate
2.8%
Mortgage Type
New Conventional
Estimated Equity
$4,680,973
Purchase Details
Closed on
Apr 18, 1994
Sold by
Mcgah E J and Mcgah Barbara
Bought by
Corash Michele B and Corash Laurence
Home Financials for this Owner
Home Financials are based on the most recent Mortgage that was taken out on this home.
Original Mortgage
$1,100,000
Interest Rate
4.75%
Create a Home Valuation Report for This Property
The Home Valuation Report is an in-depth analysis detailing your home's value as well as a comparison with similar homes in the area
Home Values in the Area
Average Home Value in this Area
Purchase History
| Date | Buyer | Sale Price | Title Company |
|---|---|---|---|
| Corash Laurence | -- | Chicago Title Company | |
| Corash Michele B | -- | First American Title Company |
Source: Public Records
Mortgage History
| Date | Status | Borrower | Loan Amount |
|---|---|---|---|
| Open | Corash Laurence | $1,100,000 | |
| Closed | Corash Michele B | $1,100,000 |
Source: Public Records
Tax History Compared to Growth
Tax History
| Year | Tax Paid | Tax Assessment Tax Assessment Total Assessment is a certain percentage of the fair market value that is determined by local assessors to be the total taxable value of land and additions on the property. | Land | Improvement |
|---|---|---|---|---|
| 2025 | $50,137 | $4,360,819 | $2,549,564 | $1,811,255 |
| 2024 | $50,137 | $4,275,314 | $2,499,573 | $1,775,741 |
| 2023 | $49,406 | $4,191,485 | $2,450,562 | $1,740,923 |
| 2022 | $48,520 | $4,109,300 | $2,402,512 | $1,706,788 |
| 2021 | $47,680 | $4,028,726 | $2,355,404 | $1,673,322 |
| 2020 | $47,827 | $3,987,418 | $2,331,253 | $1,656,165 |
| 2019 | $46,174 | $3,909,235 | $2,285,543 | $1,623,692 |
| 2018 | $43,475 | $3,734,545 | $2,240,729 | $1,493,816 |
| 2017 | $42,963 | $3,661,320 | $2,196,794 | $1,464,526 |
| 2016 | $42,337 | $3,589,530 | $2,153,720 | $1,435,810 |
| 2015 | $42,087 | $3,535,613 | $2,121,370 | $1,414,243 |
| 2014 | $40,715 | $3,466,356 | $2,079,816 | $1,386,540 |
Source: Public Records
Map
Nearby Homes
- 1070 Green St Unit 801
- 1070 Green St Unit 1001
- 1925 Leavenworth St Unit 7
- 999 Green St Unit 1501
- 999 Green St Unit 2001
- 1135 Green St
- 1950 Jones St
- 1145 Green St Unit 3
- 1100 Union St Unit 1100
- 1100 Union St Unit 1000
- 1250 Vallejo St Unit 7
- 1250 Vallejo St Unit 9
- 16 Delgado Place
- 947 Green St Unit 6
- 1281 Vallejo St Unit 4
- 1179 Filbert St
- 1750 Taylor St Unit 2202
- 1750 Taylor St Unit 1901
- 1750 Taylor St Unit 1401
- 1750 Taylor St Unit 1001
- 1070 Green St Unit 1901
- 1070 Green St Unit 303
- 1070 Green St Unit 1802
- 1070 Green St Unit 1801
- 1070 Green St Unit 1702
- 1070 Green St Unit 1701
- 1070 Green St Unit 1602
- 1070 Green St Unit 1601
- 1070 Green St Unit 1502
- 1070 Green St Unit 1501
- 1070 Green St Unit 1402
- 1070 Green St Unit 1401
- 1070 Green St Unit 1302
- 1070 Green St Unit 1301
- 1070 Green St Unit 1201
- 1070 Green St Unit 1103
- 1070 Green St Unit 601
- 1070 Green St Unit 503
- 1070 Green St Unit 502
- 1070 Green St Unit 501