Estimated Value: $576,000 - $609,137
4
Beds
3
Baths
2,003
Sq Ft
$294/Sq Ft
Est. Value
About This Home
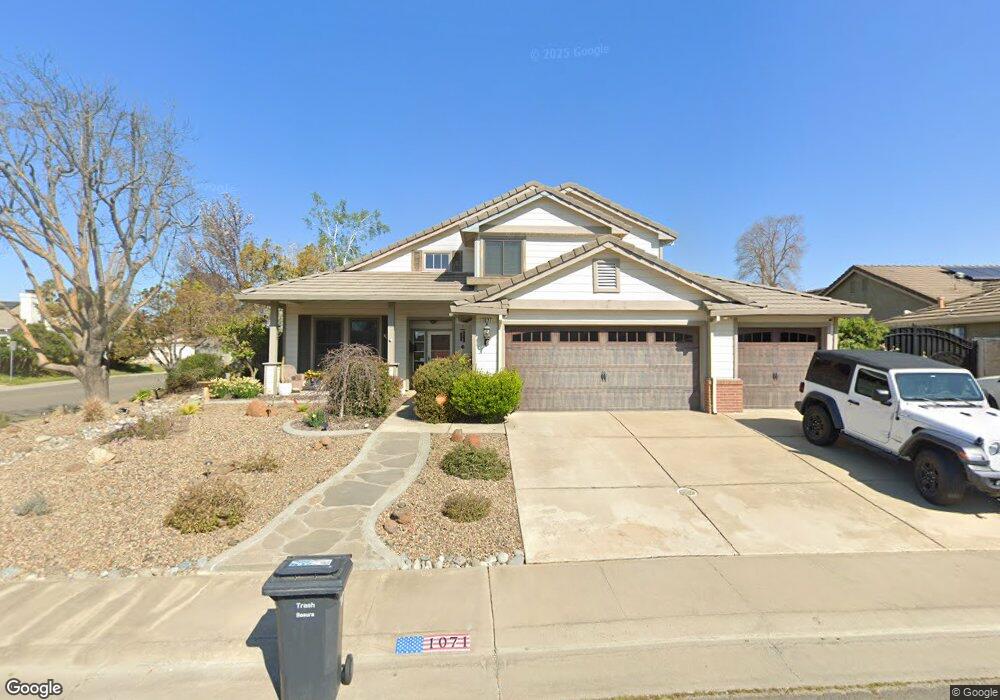
This home is located at 1071 Starbrook Dr, Galt, CA 95632 and is currently estimated at $589,284, approximately $294 per square foot. 1071 Starbrook Dr is a home located in Sacramento County with nearby schools including Marengo Ranch Elementary School, Robert L. McCaffrey Middle School, and Liberty Ranch High School.
Ownership History
Date
Name
Owned For
Owner Type
Purchase Details
Closed on
Feb 10, 2003
Sold by
Russell Jacqueline L
Bought by
Russell Robert C and Russell Jacqueline L
Current Estimated Value
Home Financials for this Owner
Home Financials are based on the most recent Mortgage that was taken out on this home.
Original Mortgage
$272,000
Outstanding Balance
$138,128
Interest Rate
8.55%
Estimated Equity
$451,156
Purchase Details
Closed on
Jun 19, 2001
Sold by
Russell Robert C and Russell Jacqueline L
Bought by
Russell Jacqueline L
Home Financials for this Owner
Home Financials are based on the most recent Mortgage that was taken out on this home.
Original Mortgage
$55,000
Interest Rate
7.15%
Mortgage Type
Stand Alone Second
Purchase Details
Closed on
Oct 21, 1993
Sold by
Morrison Homes
Bought by
Russell Robert C and Russell Jacqueline L
Home Financials for this Owner
Home Financials are based on the most recent Mortgage that was taken out on this home.
Original Mortgage
$155,581
Interest Rate
6.88%
Mortgage Type
FHA
Create a Home Valuation Report for This Property
The Home Valuation Report is an in-depth analysis detailing your home's value as well as a comparison with similar homes in the area
Home Values in the Area
Average Home Value in this Area
Purchase History
| Date | Buyer | Sale Price | Title Company |
|---|---|---|---|
| Russell Robert C | -- | First American Title Company | |
| Russell Jacqueline L | -- | -- | |
| Russell Robert C | $158,000 | Chicago Title Company |
Source: Public Records
Mortgage History
| Date | Status | Borrower | Loan Amount |
|---|---|---|---|
| Open | Russell Robert C | $272,000 | |
| Closed | Russell Jacqueline L | $55,000 | |
| Closed | Russell Robert C | $155,581 |
Source: Public Records
Tax History
| Year | Tax Paid | Tax Assessment Tax Assessment Total Assessment is a certain percentage of the fair market value that is determined by local assessors to be the total taxable value of land and additions on the property. | Land | Improvement |
|---|---|---|---|---|
| 2025 | $3,379 | $291,893 | $67,967 | $223,926 |
| 2024 | $3,379 | $286,171 | $66,635 | $219,536 |
| 2023 | $3,325 | $280,561 | $65,329 | $215,232 |
| 2022 | $3,198 | $275,061 | $64,049 | $211,012 |
| 2021 | $3,660 | $269,669 | $62,794 | $206,875 |
| 2020 | $3,634 | $266,905 | $62,151 | $204,754 |
| 2019 | $3,560 | $261,673 | $60,933 | $200,740 |
| 2018 | $3,555 | $256,543 | $59,739 | $196,804 |
| 2017 | $3,440 | $251,514 | $58,568 | $192,946 |
| 2016 | $3,353 | $246,583 | $57,420 | $189,163 |
| 2015 | $3,593 | $242,880 | $56,558 | $186,322 |
| 2014 | $3,600 | $238,124 | $55,451 | $182,673 |
Source: Public Records
Map
Nearby Homes
- 1021 Marina Bay Ct
- 1026 Starbrook Dr
- 914 Cedar Canyon Cir
- 988 Padbury Ct
- 1049 Lake Park Ave
- 975 Rossburn Way
- 1150 Bellawood Dr
- 898 Lake Park Cir
- 2032 Seraphina St
- 2012 Seraphina St
- 1165 Monique St
- 2028 Seraphina St
- 1173 Monique St
- 1164 Monique St
- 1169 Monique St
- 1160 Cathy St
- 2016 Seraphina St
- 2020 Seraphina St
- 1172 Monique St
- 2024 Seraphina St
- 1067 Starbrook Dr
- 940 Lake Canyon Ave
- 944 Lake Canyon Ave
- 931 Courtenay Ct
- 1053 Tierra Creek Dr
- 948 Lake Canyon Ave
- 1063 Starbrook Dr
- 932 Lake Canyon Ave
- 1054 Tierra Creek Dr
- 952 Lake Canyon Ave
- 1049 Tierra Creek Dr
- 927 Courtenay Ct
- 928 Lake Canyon Ave
- 945 Lake Canyon Ave
- 1050 Starbrook Dr
- 956 Lake Canyon Ave
- 949 Lake Canyon Ave
- 941 Lake Canyon Ave
- 1050 Tierra Creek Dr
Your Personal Tour Guide
Ask me questions while you tour the home.