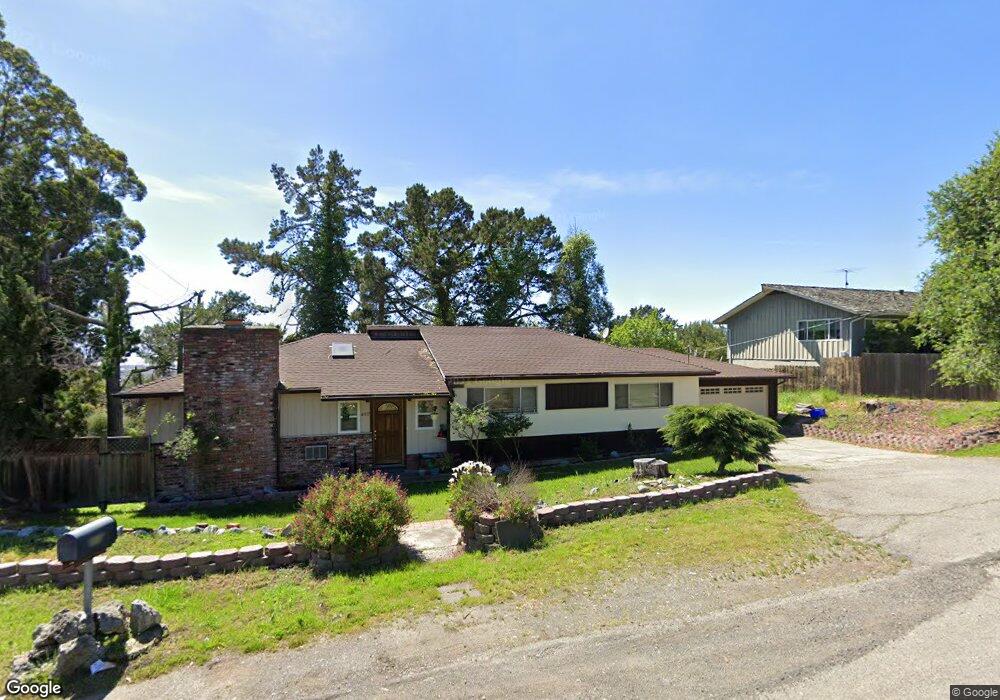
10717 Snowdown Ave Oakland, CA 94605
Chabot Park NeighborhoodEstimated Value: $796,000 - $1,045,000
3
Beds
2
Baths
1,627
Sq Ft
$569/Sq Ft
Est. Value
About This Home
This home is located at 10717 Snowdown Ave, Oakland, CA 94605 and is currently estimated at $925,814, approximately $569 per square foot. 10717 Snowdown Ave is a home located in Alameda County with nearby schools including Grass Valley Elementary School, Elmhurst United Middle School, and Skyline High School.
Ownership History
Date
Name
Owned For
Owner Type
Purchase Details
Closed on
Jun 29, 2005
Sold by
Bullard Lynee M
Bought by
Bullard Keith and Bullard Lynee M
Current Estimated Value
Home Financials for this Owner
Home Financials are based on the most recent Mortgage that was taken out on this home.
Original Mortgage
$325,000
Outstanding Balance
$168,776
Interest Rate
5.58%
Mortgage Type
New Conventional
Estimated Equity
$757,038
Purchase Details
Closed on
Oct 22, 2002
Sold by
Bullard Lynee M and Bullard Keith
Bought by
Bullard Keith and Bullard Lynee M
Home Financials for this Owner
Home Financials are based on the most recent Mortgage that was taken out on this home.
Original Mortgage
$300,700
Interest Rate
6.09%
Purchase Details
Closed on
Sep 4, 1998
Sold by
Sato William K and Saur Alexandra W
Bought by
Bullard Keith and Mcintosh Lynee
Home Financials for this Owner
Home Financials are based on the most recent Mortgage that was taken out on this home.
Original Mortgage
$209,700
Interest Rate
6.92%
Create a Home Valuation Report for This Property
The Home Valuation Report is an in-depth analysis detailing your home's value as well as a comparison with similar homes in the area
Home Values in the Area
Average Home Value in this Area
Purchase History
| Date | Buyer | Sale Price | Title Company |
|---|---|---|---|
| Bullard Keith | -- | Transnation Title Southland | |
| Bullard Lynee M | -- | Multiple | |
| Bullard Keith | -- | Commonwealth Land Title | |
| Bullard Keith | $233,000 | Financial Title Company |
Source: Public Records
Mortgage History
| Date | Status | Borrower | Loan Amount |
|---|---|---|---|
| Open | Bullard Lynee M | $325,000 | |
| Closed | Bullard Keith | $300,700 | |
| Closed | Bullard Keith | $209,700 |
Source: Public Records
Tax History Compared to Growth
Tax History
| Year | Tax Paid | Tax Assessment Tax Assessment Total Assessment is a certain percentage of the fair market value that is determined by local assessors to be the total taxable value of land and additions on the property. | Land | Improvement |
|---|---|---|---|---|
| 2025 | $6,479 | $358,254 | $109,576 | $255,678 |
| 2024 | $6,479 | $351,094 | $107,428 | $250,666 |
| 2023 | $6,595 | $351,074 | $105,322 | $245,752 |
| 2022 | $6,381 | $337,191 | $103,257 | $240,934 |
| 2021 | $6,024 | $330,444 | $101,233 | $236,211 |
| 2020 | $5,955 | $333,984 | $100,195 | $233,789 |
| 2019 | $5,682 | $327,437 | $98,231 | $229,206 |
| 2018 | $5,562 | $321,017 | $96,305 | $224,712 |
| 2017 | $5,330 | $314,724 | $94,417 | $220,307 |
| 2016 | $5,125 | $308,554 | $92,566 | $215,988 |
| 2015 | $5,170 | $303,920 | $91,176 | $212,744 |
| 2014 | $5,129 | $297,967 | $89,390 | $208,577 |
Source: Public Records
Map
Nearby Homes
- 0 Lochard St Unit 41113902
- 11201 Lochard St
- 9 Leamont Ct
- 11320 Lochard St
- 10838 Monan St
- 25 Woodcliff Ct
- 11275 Kerrigan Dr
- 11388 Lochard St
- 10353 Royal Oak Rd
- 10317 Royal Oak Rd
- 10492 Royal Oak Rd
- 10910 Glen Artney St
- 3910 Oak Hill Rd
- 4847 Dunkirk Ave
- 142 Sequoyah View Dr
- 10768 Sheldon St
- 2 Sequoyah View Dr
- 85 Sequoyah View Dr
- 10601 Sheldon St
- 4145 Oak Hill Rd
- 4039 Malcolm Ave
- 10701 Snowdown Ave
- 4031 Malcolm Ave
- 4101 Malcolm Ave
- 10700 Snowdown Ave
- 4021 Malcolm Ave
- 10835 Snowdown Ave
- 10810 Snowdown Ave
- 4100 Malcolm Ave
- 4015 Malcolm Ave
- 10830 Snowdown Ave
- 4131 Malcolm Ave
- 4026 Malcolm Ave
- 10701 Cameron Ave
- 4010 Malcolm Ave
- 4134 Malcolm Ave
- 4009 Malcolm Ave
- 10841 Cameron Ave
- 10855 Snowdown Ave
- 10840 Snowdown Ave