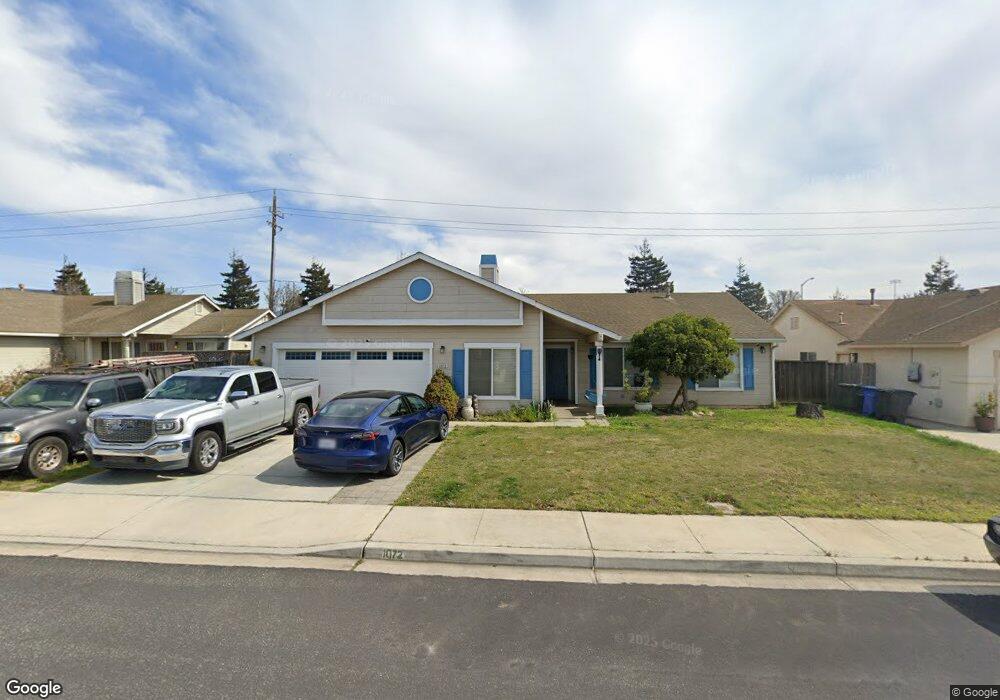
1072 Viewpointe St Soledad, CA 93960
Estimated Value: $592,521 - $674,000
3
Beds
2
Baths
1,396
Sq Ft
$457/Sq Ft
Est. Value
About This Home
This home is located at 1072 Viewpointe St, Soledad, CA 93960 and is currently estimated at $638,630, approximately $457 per square foot. 1072 Viewpointe St is a home located in Monterey County with nearby schools including Rose Ferrero Elementary School, Main Street Middle School, and Soledad High School.
Ownership History
Date
Name
Owned For
Owner Type
Purchase Details
Closed on
Mar 3, 2006
Sold by
Rosales Raeann
Bought by
Rosales Oscar
Current Estimated Value
Home Financials for this Owner
Home Financials are based on the most recent Mortgage that was taken out on this home.
Original Mortgage
$390,000
Outstanding Balance
$235,698
Interest Rate
7.37%
Mortgage Type
New Conventional
Estimated Equity
$402,932
Purchase Details
Closed on
Jul 16, 2004
Sold by
Rosales Oscar
Bought by
Rosales Oscar and Rosales Raeann
Purchase Details
Closed on
Jan 13, 2000
Sold by
Rosales Raeann
Bought by
Rosales Oscar
Purchase Details
Closed on
Jun 26, 1996
Sold by
South County Homes Ii
Bought by
Rosales Oscar
Home Financials for this Owner
Home Financials are based on the most recent Mortgage that was taken out on this home.
Original Mortgage
$170,698
Interest Rate
7.84%
Mortgage Type
VA
Create a Home Valuation Report for This Property
The Home Valuation Report is an in-depth analysis detailing your home's value as well as a comparison with similar homes in the area
Home Values in the Area
Average Home Value in this Area
Purchase History
| Date | Buyer | Sale Price | Title Company |
|---|---|---|---|
| Rosales Oscar | -- | Chicago Title Co | |
| Rosales Oscar | -- | Chicago Title Company | |
| Rosales Oscar | -- | Chicago Title Co | |
| Rosales Oscar | $166,000 | Chicago Title Co |
Source: Public Records
Mortgage History
| Date | Status | Borrower | Loan Amount |
|---|---|---|---|
| Open | Rosales Oscar | $390,000 | |
| Previous Owner | Rosales Oscar | $170,698 |
Source: Public Records
Tax History
| Year | Tax Paid | Tax Assessment Tax Assessment Total Assessment is a certain percentage of the fair market value that is determined by local assessors to be the total taxable value of land and additions on the property. | Land | Improvement |
|---|---|---|---|---|
| 2025 | $3,220 | $255,128 | $76,842 | $178,286 |
| 2024 | $3,220 | $250,127 | $75,336 | $174,791 |
| 2023 | $2,919 | $245,223 | $73,859 | $171,364 |
| 2022 | $2,960 | $240,415 | $72,411 | $168,004 |
| 2021 | $2,863 | $235,702 | $70,992 | $164,710 |
| 2020 | $2,818 | $233,287 | $70,265 | $163,022 |
| 2019 | $2,756 | $228,714 | $68,888 | $159,826 |
| 2018 | $2,796 | $224,231 | $67,538 | $156,693 |
| 2017 | $2,699 | $219,835 | $66,214 | $153,621 |
| 2016 | $2,579 | $215,525 | $64,916 | $150,609 |
| 2015 | $2,543 | $212,288 | $63,941 | $148,347 |
| 2014 | $2,532 | $208,131 | $62,689 | $145,442 |
Source: Public Records
Map
Nearby Homes
- 1253 La Paz Ct
- 715 Skinner St
- 509 Davalos St
- 604 Gardenia Place
- 1231 Carmelo
- 449 Sage Ct
- 965 Las Flores St
- 35095 Metz Rd
- 704 Gabilan Dr
- 836 Vasquez Dr
- 570 Tankersley St
- 638 Robledo Dr
- 665 Molera Ave
- 615 Monterey St
- 1117 Palm Ave
- 31102 Camphora Gloria Rd
- 33900 Fabry Rd
- 35700 Eagle Ridge
- 36527 Metz Rd
- 31462 El Camino Real
- 1084 Viewpointe St
- 1060 Viewpointe St
- 1058 Viewpointe St
- 1086 Viewpointe St
- 1075 Viewpointe St
- 1063 Viewpointe St
- 1087 Viewpointe St
- 1046 Viewpointe St
- 1089 Viewpointe St
- 1051 Viewpointe St
- 1098 Viewpointe St
- 350 Sentinel St
- 394 Entrada Dr
- 359 Sentinel St
- 1049 Viewpointe St
- 1034 Viewpointe St
- 340 Sentinel St
- 382 Entrada Dr
- 341 Sentinel St
- 1037 Viewpointe St
Your Personal Tour Guide
Ask me questions while you tour the home.