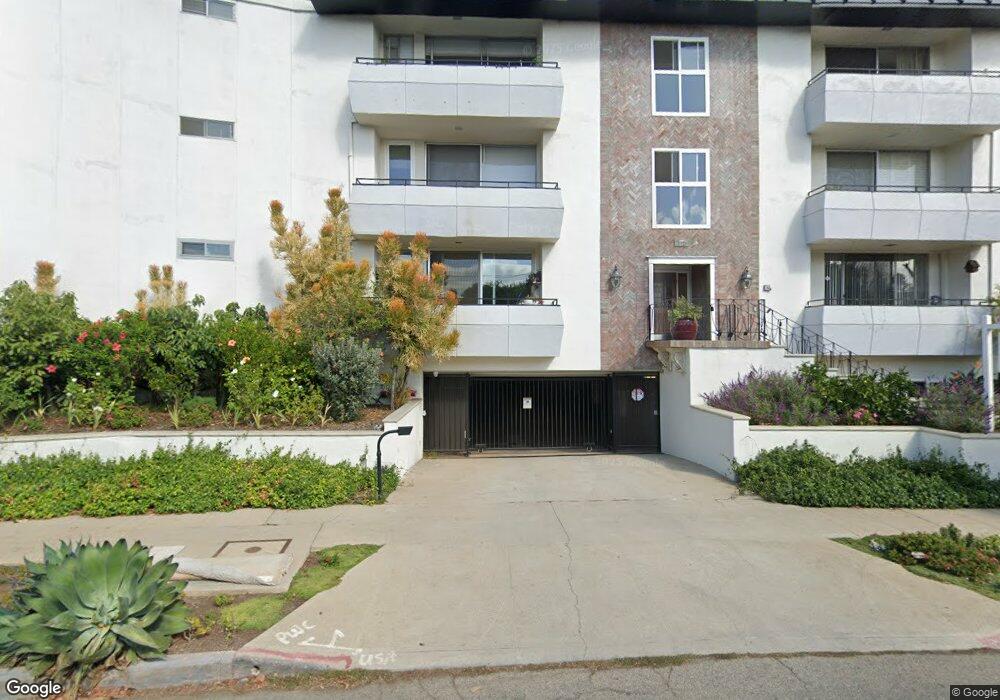
10725 Ohio Ave Unit 5 Los Angeles, CA 90024
Westwood NeighborhoodEstimated Value: $822,920 - $1,001,000
2
Beds
2
Baths
1,178
Sq Ft
$793/Sq Ft
Est. Value
About This Home
This home is located at 10725 Ohio Ave Unit 5, Los Angeles, CA 90024 and is currently estimated at $933,980, approximately $792 per square foot. 10725 Ohio Ave Unit 5 is a home located in Los Angeles County with nearby schools including Fairburn Avenue Elementary, Westwood Charter School, and Ralph Waldo Emerson Community Charter Middle School.
Ownership History
Date
Name
Owned For
Owner Type
Purchase Details
Closed on
Mar 11, 2020
Sold by
Nguyen Van T and Van T Nguyen Seperate Property
Bought by
Sanctuary Properties Llc
Current Estimated Value
Purchase Details
Closed on
Nov 1, 2018
Sold by
Nguyen Van T
Bought by
Nguyen Van T and Van T Nguyen Separate Property
Purchase Details
Closed on
Jul 6, 2009
Sold by
Winchell Ann Louise Gray
Bought by
Nguyen Van T
Home Financials for this Owner
Home Financials are based on the most recent Mortgage that was taken out on this home.
Original Mortgage
$320,000
Interest Rate
5.37%
Mortgage Type
Purchase Money Mortgage
Purchase Details
Closed on
Mar 21, 2008
Sold by
Winchell Ann Louise Gray and Thelma S Spencer Living Trust
Bought by
Winchell Ann Louise Gray
Purchase Details
Closed on
Nov 14, 1995
Sold by
Spencer Thelma S
Bought by
Spencer Thelma S and Thelma S Spencer Living Trust
Create a Home Valuation Report for This Property
The Home Valuation Report is an in-depth analysis detailing your home's value as well as a comparison with similar homes in the area
Home Values in the Area
Average Home Value in this Area
Purchase History
| Date | Buyer | Sale Price | Title Company |
|---|---|---|---|
| Sanctuary Properties Llc | -- | None Available | |
| Nguyen Van T | -- | None Available | |
| Nguyen Van T | $465,500 | Fidelity National Title | |
| Winchell Ann Louise Gray | -- | None Available | |
| Spencer Thelma S | -- | -- |
Source: Public Records
Mortgage History
| Date | Status | Borrower | Loan Amount |
|---|---|---|---|
| Previous Owner | Nguyen Van T | $320,000 |
Source: Public Records
Tax History Compared to Growth
Tax History
| Year | Tax Paid | Tax Assessment Tax Assessment Total Assessment is a certain percentage of the fair market value that is determined by local assessors to be the total taxable value of land and additions on the property. | Land | Improvement |
|---|---|---|---|---|
| 2025 | $7,211 | $600,862 | $409,055 | $191,807 |
| 2024 | $7,211 | $589,082 | $401,035 | $188,047 |
| 2023 | $7,074 | $577,532 | $393,172 | $184,360 |
| 2022 | $6,746 | $566,209 | $385,463 | $180,746 |
| 2021 | $6,658 | $555,107 | $377,905 | $177,202 |
| 2020 | $6,642 | $549,417 | $374,031 | $175,386 |
| 2019 | $6,376 | $538,646 | $366,698 | $171,948 |
| 2018 | $6,353 | $528,085 | $359,508 | $168,577 |
| 2016 | $6,069 | $507,581 | $345,549 | $162,032 |
| 2015 | $5,979 | $499,958 | $340,359 | $159,599 |
| 2014 | $6,002 | $490,165 | $333,692 | $156,473 |
Source: Public Records
Map
Nearby Homes
- 10721 Ohio Ave
- 10725 Ohio Ave Unit PH2
- 10725 Ohio Ave Unit 301
- 10745 Ohio Ave
- 10735 Rochester Ave
- 10687 Wilkins Ave Unit 1
- 1551 Manning Ave Unit 101
- 10671 Wilkins Ave Unit 5
- 10633 Kinnard Ave Unit 1
- 10724 Wilshire Blvd Unit 1001
- 10724 Wilshire Blvd Unit 1209
- 10724 Wilshire Blvd Unit 1501
- 10724 Wilshire Blvd Unit 1402
- 10724 Wilshire Blvd Unit 607
- 10724 Wilshire Blvd Unit 1005
- 1601 Hilts Ave Unit 3
- 10750 Wilshire Blvd Unit 203
- 10660 Wilshire Blvd Unit 609
- 10627 Ashton Ave Unit 103
- 1621 Manning Ave
- 10725 Ohio Ave
- 10725 Ohio Ave Unit PH5
- 10725 Ohio Ave Unit PNTHSE
- 10725 Ohio Ave Unit PNTHSE 2
- 10725 Ohio Ave Unit PNTHSE 3
- 10725 Ohio Ave Unit PH4
- 10725 Ohio Ave Unit PH3
- 10725 Ohio Ave Unit PH1
- 10725 Ohio Ave Unit 205
- 10725 Ohio Ave Unit 204
- 10725 Ohio Ave Unit 203
- 10725 Ohio Ave Unit 202
- 10725 Ohio Ave Unit 201
- 10725 Ohio Ave Unit 15
- 10725 Ohio Ave Unit 305
- 10725 Ohio Ave Unit 304
- 10725 Ohio Ave Unit 303
- 10725 Ohio Ave Unit 302
- 10733 Ohio Ave Unit 1/2
- 10733 Ohio Ave