Estimated Value: $655,000 - $1,084,000
3
Beds
2
Baths
2,290
Sq Ft
$381/Sq Ft
Est. Value
About This Home
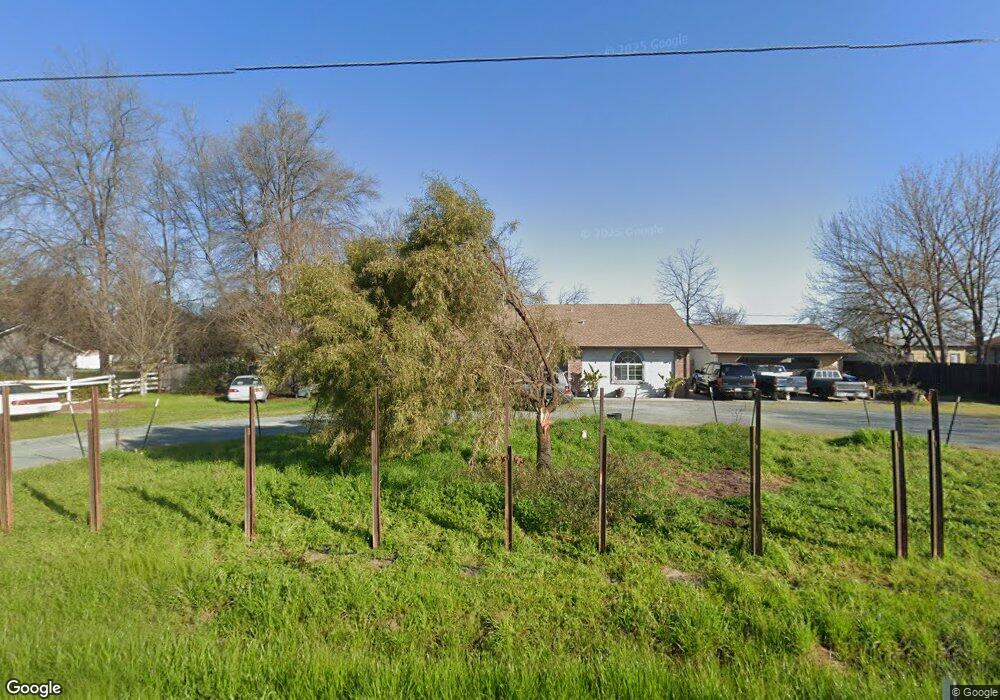
This home is located at 10745 Simmerhorn Rd, Galt, CA 95632 and is currently estimated at $873,439, approximately $381 per square foot. 10745 Simmerhorn Rd is a home located in Sacramento County with nearby schools including River Oaks Elementary School, Robert L. McCaffrey Middle School, and Galt High School.
Ownership History
Date
Name
Owned For
Owner Type
Purchase Details
Closed on
May 25, 2006
Sold by
Schmidt Brian R and Sonoda Wanda J
Bought by
Flores Aristeo H and Flores Isabel G
Current Estimated Value
Home Financials for this Owner
Home Financials are based on the most recent Mortgage that was taken out on this home.
Original Mortgage
$407,000
Outstanding Balance
$242,658
Interest Rate
6.92%
Mortgage Type
Balloon
Estimated Equity
$630,781
Purchase Details
Closed on
Mar 24, 2003
Sold by
Schmidt Brian R and Schmidt Wanda J
Bought by
Schmidt Brian R and Schmidt Wanda J
Home Financials for this Owner
Home Financials are based on the most recent Mortgage that was taken out on this home.
Original Mortgage
$200,000
Interest Rate
5.79%
Purchase Details
Closed on
May 15, 1996
Sold by
Schmidt Brian R and Schmidt Wanda J
Bought by
Schmidt Brian R and Schmidt Wanda J
Create a Home Valuation Report for This Property
The Home Valuation Report is an in-depth analysis detailing your home's value as well as a comparison with similar homes in the area
Home Values in the Area
Average Home Value in this Area
Purchase History
| Date | Buyer | Sale Price | Title Company |
|---|---|---|---|
| Flores Aristeo H | $607,000 | Chicago Title Co | |
| Schmidt Brian R | -- | Fidelity National Title | |
| Schmidt Brian R | -- | -- |
Source: Public Records
Mortgage History
| Date | Status | Borrower | Loan Amount |
|---|---|---|---|
| Open | Flores Aristeo H | $407,000 | |
| Previous Owner | Schmidt Brian R | $200,000 |
Source: Public Records
Tax History
| Year | Tax Paid | Tax Assessment Tax Assessment Total Assessment is a certain percentage of the fair market value that is determined by local assessors to be the total taxable value of land and additions on the property. | Land | Improvement |
|---|---|---|---|---|
| 2025 | $9,164 | $829,502 | $254,176 | $575,326 |
| 2024 | $9,164 | $813,239 | $249,193 | $564,046 |
| 2023 | $8,975 | $797,294 | $244,307 | $552,987 |
| 2022 | $8,622 | $781,662 | $239,517 | $542,145 |
| 2021 | $8,635 | $766,336 | $234,821 | $531,515 |
| 2020 | $8,563 | $758,479 | $232,414 | $526,065 |
| 2019 | $8,351 | $743,607 | $227,857 | $515,750 |
| 2018 | $8,339 | $729,028 | $223,390 | $505,638 |
| 2017 | $8,012 | $714,734 | $219,010 | $495,724 |
| 2016 | $7,339 | $667,891 | $204,657 | $463,234 |
| 2015 | $6,724 | $624,198 | $191,269 | $432,929 |
| 2014 | $6,164 | $562,340 | $172,314 | $390,026 |
Source: Public Records
Map
Nearby Homes
- 1352 Winterhart St
- 1348 Winterhart St
- 1344 Winterhart St
- 1340 Winterhart St
- 1332 Winterhart St
- 1328 Winterhart St
- 1324 Winterhart St
- 1355 Winterhart St
- 1351 Winterhart St
- 1347 Winterhart St
- 1320 Winterhart St
- 1343 Winterhart St
- 1316 Winterhart St
- 1331 Winterhart St
- 1327 Winterhart St
- 1323 Winterhart St
- 1319 Winterhart St
- 10657 Simmerhorn Rd
- 1339 Winterhart St
- 1249 Mccabe Cir
- 1 Simmerhorn Rd
- 10735 Simmerhorn Rd
- 10725 Simmerhorn Rd
- 10779 Simmerhorn Rd
- 10711 Simmerhorn Rd
- 10789 Simmerhorn Rd
- 10701 Simmerhorn Rd
- 10799 Simmerhorn Rd
- 10691 Simmerhorn Rd
- 13522 Steiner Rd
- 10811 Simmerhorn Rd
- 13535 Steiner Rd
- 13554 Steiner Rd
- 10787 Simmerhorn Rd
- 10821 Simmerhorn Rd
- 13544 Steiner Rd
- 13531 Steiner Rd
- 10680 Simmerhorn Rd
- 10783 Simmerhorn Rd
- 10831 Simmerhorn Rd
Your Personal Tour Guide
Ask me questions while you tour the home.