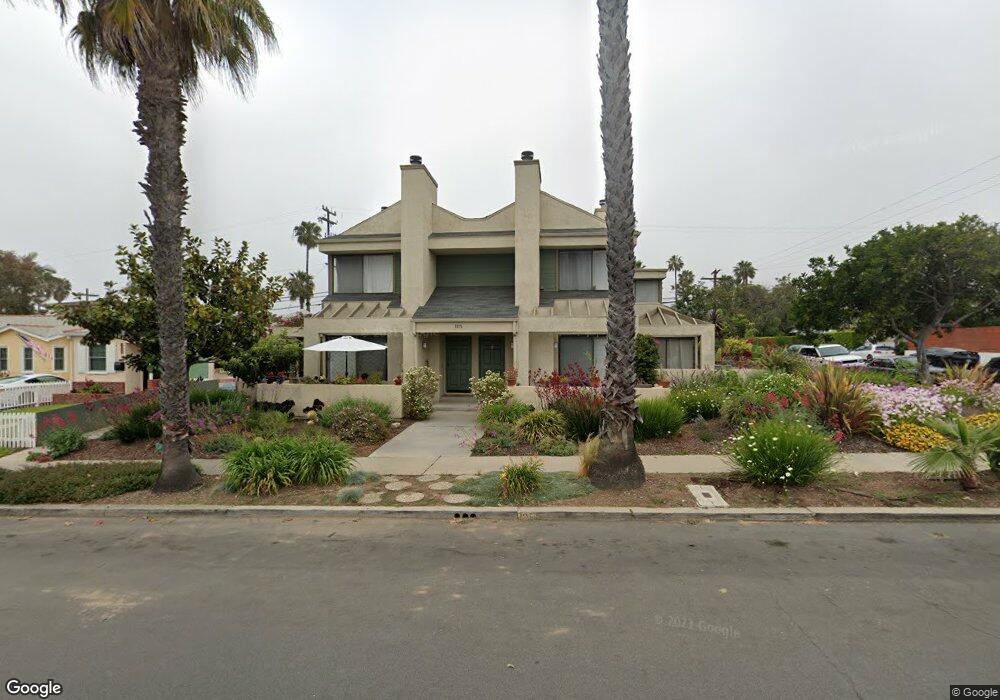
1076 Opal St Unit 1 San Diego, CA 92109
Pacific Beach NeighborhoodEstimated Value: $1,166,000 - $1,407,000
3
Beds
3
Baths
1,431
Sq Ft
$901/Sq Ft
Est. Value
About This Home
This home is located at 1076 Opal St Unit 1, San Diego, CA 92109 and is currently estimated at $1,289,688, approximately $901 per square foot. 1076 Opal St Unit 1 is a home located in San Diego County with nearby schools including Pacific Beach Elementary School, Pacific Beach Middle, and Mission Bay High School.
Ownership History
Date
Name
Owned For
Owner Type
Purchase Details
Closed on
Sep 27, 2024
Sold by
Santaella Tomas Galvez
Bought by
Galvez Salazar Family Trust and Santaella
Current Estimated Value
Purchase Details
Closed on
May 11, 2013
Sold by
Huber David E
Bought by
Santaella Tomas Galvez
Home Financials for this Owner
Home Financials are based on the most recent Mortgage that was taken out on this home.
Original Mortgage
$496,699
Interest Rate
3.37%
Mortgage Type
New Conventional
Purchase Details
Closed on
Nov 10, 2009
Sold by
Heldemann Eleanore C
Bought by
Huber David E
Home Financials for this Owner
Home Financials are based on the most recent Mortgage that was taken out on this home.
Original Mortgage
$547,200
Interest Rate
5.01%
Mortgage Type
Unknown
Purchase Details
Closed on
Nov 26, 1986
Create a Home Valuation Report for This Property
The Home Valuation Report is an in-depth analysis detailing your home's value as well as a comparison with similar homes in the area
Home Values in the Area
Average Home Value in this Area
Purchase History
| Date | Buyer | Sale Price | Title Company |
|---|---|---|---|
| Galvez Salazar Family Trust | -- | None Listed On Document | |
| Santaella Tomas Galvez | $662,500 | Fidelity National Title | |
| Huber David E | -- | Fidelity National Title | |
| Huber David E | $608,000 | California Title Company | |
| Huber David E | -- | California Title Company | |
| -- | $145,000 | -- |
Source: Public Records
Mortgage History
| Date | Status | Borrower | Loan Amount |
|---|---|---|---|
| Previous Owner | Santaella Tomas Galvez | $496,699 | |
| Previous Owner | Huber David E | $547,200 |
Source: Public Records
Tax History Compared to Growth
Tax History
| Year | Tax Paid | Tax Assessment Tax Assessment Total Assessment is a certain percentage of the fair market value that is determined by local assessors to be the total taxable value of land and additions on the property. | Land | Improvement |
|---|---|---|---|---|
| 2025 | $9,851 | $815,521 | $652,653 | $162,868 |
| 2024 | $9,851 | $799,531 | $639,856 | $159,675 |
| 2023 | $9,634 | $783,855 | $627,310 | $156,545 |
| 2022 | $9,378 | $768,486 | $615,010 | $153,476 |
| 2021 | $9,228 | $753,418 | $602,951 | $150,467 |
| 2020 | $9,115 | $745,694 | $596,769 | $148,925 |
| 2019 | $8,951 | $731,073 | $585,068 | $146,005 |
| 2018 | $8,367 | $716,740 | $573,597 | $143,143 |
| 2017 | $8,167 | $702,687 | $562,350 | $140,337 |
| 2016 | $8,036 | $688,910 | $551,324 | $137,586 |
| 2015 | $7,916 | $678,563 | $543,043 | $135,520 |
| 2014 | $7,790 | $665,272 | $532,406 | $132,866 |
Source: Public Records
Map
Nearby Homes
- 1025 Wilbur Ave
- 4944 Cass St Unit 407
- 938 Opal St
- 1154 Sapphire St
- 972 Sapphire St Unit LA1
- 974 Sapphire St Unit LA2
- 976 Sapphire St Unit LA3
- 1148 Turquoise St
- 1059 Agate St Unit A
- 5209 Foothill Blvd
- 1045 Van Nuys St
- 751-63 Turquoise St Unit 27-30
- 1220 Emerald St
- 1505 Loring St
- 1270 Emerald St
- 819 Van Nuys St
- 4767 Ocean Blvd
- 4767 Ocean Blvd Unit 411
- 1326 Caminito Arriata
- 5452 Moonlight Ln
- 1076 Opal St Unit 6
- 1076 Opal St Unit 5
- 1076 Opal St Unit 4
- 1076 Opal St Unit 3
- 1076 Opal St Unit 2
- 1066 Opal St Unit 68
- 1060 Opal St
- 5076 Dawes St
- 1052 Opal St Unit 54
- 1102 Opal St
- 1054 Opal St Unit B
- 5086 Dawes St
- 1059 Tourmaline St
- 5088 Dawes St Unit 4
- 1075 Tourmaline St
- 1077 Tourmaline St
- 1048 Opal St
- 1044 Opal St
- 1046 Opal St
- 1110 Opal St