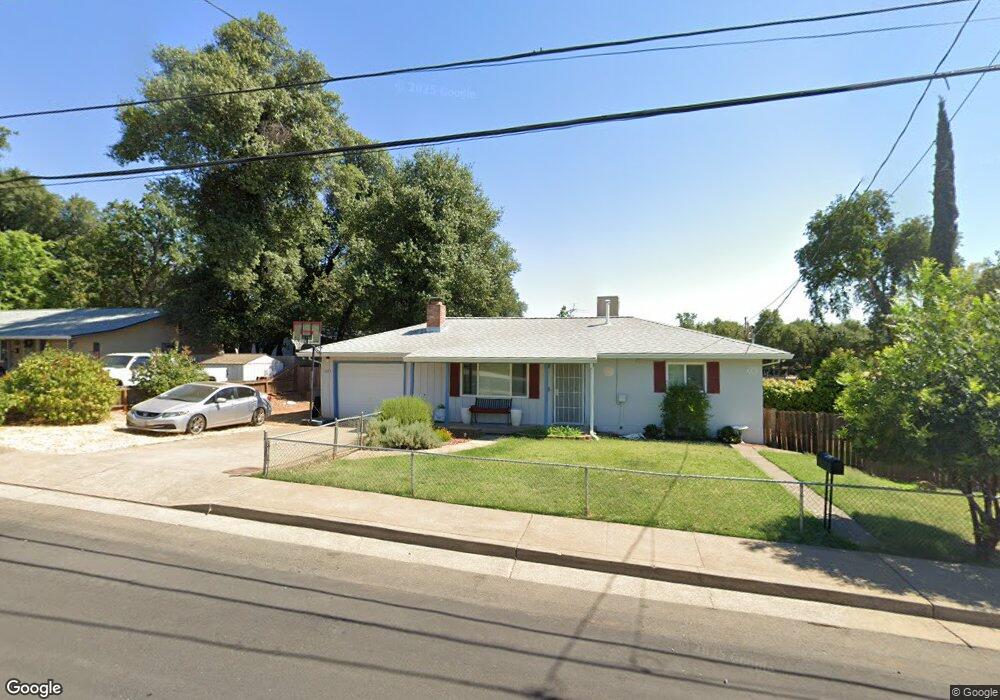
1077 Harpole Rd Redding, CA 96002
Enterprise NeighborhoodEstimated Value: $244,365 - $304,000
2
Beds
1
Bath
865
Sq Ft
$310/Sq Ft
Est. Value
About This Home
This home is located at 1077 Harpole Rd, Redding, CA 96002 and is currently estimated at $268,091, approximately $309 per square foot. 1077 Harpole Rd is a home located in Shasta County with nearby schools including Lassen View Elementary School, Parsons Junior High School, and Enterprise High School.
Ownership History
Date
Name
Owned For
Owner Type
Purchase Details
Closed on
Jun 4, 2024
Sold by
Wesley Marcia
Bought by
Marcia Wesley Revocable Living Trust and Wesley
Current Estimated Value
Purchase Details
Closed on
Jun 29, 2010
Sold by
Price Maudie
Bought by
Wesley Marcia
Home Financials for this Owner
Home Financials are based on the most recent Mortgage that was taken out on this home.
Original Mortgage
$87,225
Interest Rate
4.82%
Mortgage Type
FHA
Purchase Details
Closed on
Jun 2, 2006
Sold by
Lear Richard N and Lear Carolyn L
Bought by
Price Maudie A
Home Financials for this Owner
Home Financials are based on the most recent Mortgage that was taken out on this home.
Original Mortgage
$165,600
Interest Rate
8.5%
Mortgage Type
Fannie Mae Freddie Mac
Create a Home Valuation Report for This Property
The Home Valuation Report is an in-depth analysis detailing your home's value as well as a comparison with similar homes in the area
Home Values in the Area
Average Home Value in this Area
Purchase History
| Date | Buyer | Sale Price | Title Company |
|---|---|---|---|
| Marcia Wesley Revocable Living Trust | -- | None Listed On Document | |
| Wesley Marcia | $88,500 | Fidelity Natl Title Co Of Ca | |
| Price Maudie A | $190,000 | Placer Title Company |
Source: Public Records
Mortgage History
| Date | Status | Borrower | Loan Amount |
|---|---|---|---|
| Previous Owner | Wesley Marcia | $87,225 | |
| Previous Owner | Price Maudie A | $165,600 |
Source: Public Records
Tax History
| Year | Tax Paid | Tax Assessment Tax Assessment Total Assessment is a certain percentage of the fair market value that is determined by local assessors to be the total taxable value of land and additions on the property. | Land | Improvement |
|---|---|---|---|---|
| 2025 | $1,188 | $225,000 | $45,000 | $180,000 |
| 2024 | $1,170 | $111,859 | $50,615 | $61,244 |
| 2023 | $1,170 | $109,667 | $49,623 | $60,044 |
| 2022 | $1,135 | $107,517 | $48,650 | $58,867 |
| 2021 | $1,095 | $105,410 | $47,697 | $57,713 |
| 2020 | $1,089 | $104,330 | $47,208 | $57,122 |
| 2019 | $1,079 | $102,285 | $46,283 | $56,002 |
| 2018 | $1,065 | $100,280 | $45,376 | $54,904 |
| 2017 | $1,081 | $98,315 | $44,487 | $53,828 |
| 2016 | $1,011 | $96,388 | $43,615 | $52,773 |
| 2015 | $1,001 | $94,941 | $42,960 | $51,981 |
| 2014 | $992 | $93,082 | $42,119 | $50,963 |
Source: Public Records
Map
Nearby Homes
- 1354 Harpole Rd
- 3527 Adams Ln
- 3759 Alma Ave
- 4020 Churn Creek Rd
- 737 Estate St
- 1397 Empress Ln
- 3540 Ricardo Ave
- 688 Julie Way
- 1091 Del Sol Place
- 1513 Harpole Rd
- 3360 Lawrence Rd
- 3708 Traverse St
- 1075 Le Brun Ln
- 3689 Suzanne Way
- 3178 Lawrence Rd
- 1108 4th St
- 3293 Middleton Ln
- 3087 Northwoods Way
- 4323 Churn Crk Rd
- 751 Woodacre Dr
- 1063 Harpole Rd
- 1091 Harpole Rd
- 1055 Harpole Rd
- 1082 Harpole Rd
- 1095 Harpole 1weup7ny0hdu
- 1095 Harpole Rd
- 1046 Harpole Rd
- 0 Harpole Road Lot C
- 1088 Harpole Rd
- 1036 Harpole Rd
- 1119 Harpole Rd
- 1116 Harpole Rd
- 3737 Churn Creek Rd
- 1099 Harpole Rd
- 3739 Churn Creek Rd
- 3729 Churn Creek Rd
- 3723 Churn Creek Rd
- 1030 Harpole Rd
- 1128 Harpole Rd
- 1133 Ruthie Ln
Your Personal Tour Guide
Ask me questions while you tour the home.