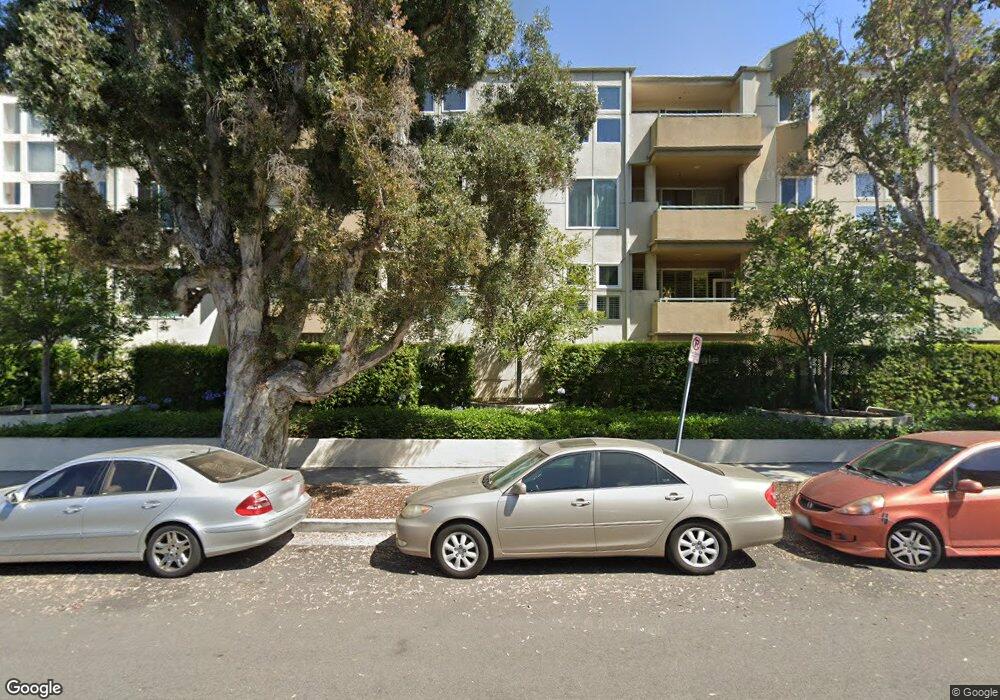
10790 Rose Ave Unit 405 Los Angeles, CA 90034
Estimated Value: $827,161 - $1,122,000
2
Beds
2
Baths
1,364
Sq Ft
$692/Sq Ft
Est. Value
About This Home
This home is located at 10790 Rose Ave Unit 405, Los Angeles, CA 90034 and is currently estimated at $943,290, approximately $691 per square foot. 10790 Rose Ave Unit 405 is a home located in Los Angeles County with nearby schools including Charnock Road Elementary School, Palms Middle School, and Venice High School.
Ownership History
Date
Name
Owned For
Owner Type
Purchase Details
Closed on
Jun 17, 2011
Sold by
Padveen Kenneth B and Padveen Marie J
Bought by
Capodanno Pamela
Current Estimated Value
Home Financials for this Owner
Home Financials are based on the most recent Mortgage that was taken out on this home.
Original Mortgage
$366,000
Outstanding Balance
$250,170
Interest Rate
4.45%
Mortgage Type
Purchase Money Mortgage
Estimated Equity
$693,120
Purchase Details
Closed on
Nov 28, 2001
Sold by
Valentine Lindsey A and Rumsey Sheila G
Bought by
Padveen Kenneth B
Purchase Details
Closed on
May 16, 1997
Sold by
Valentine Lindsey A
Bought by
Valentine Lindsey A
Purchase Details
Closed on
Jun 6, 1996
Sold by
Rose Avenue Vistas Lp
Bought by
Valentine Lindsey A
Home Financials for this Owner
Home Financials are based on the most recent Mortgage that was taken out on this home.
Original Mortgage
$86,000
Interest Rate
8.25%
Create a Home Valuation Report for This Property
The Home Valuation Report is an in-depth analysis detailing your home's value as well as a comparison with similar homes in the area
Home Values in the Area
Average Home Value in this Area
Purchase History
| Date | Buyer | Sale Price | Title Company |
|---|---|---|---|
| Capodanno Pamela | $459,000 | Fidelity Natl Title Ins Co | |
| Padveen Kenneth B | $325,000 | Fidelity National Title | |
| Valentine Lindsey A | -- | -- | |
| Valentine Lindsey A | $186,000 | Continental Lawyers Title Co |
Source: Public Records
Mortgage History
| Date | Status | Borrower | Loan Amount |
|---|---|---|---|
| Open | Capodanno Pamela | $366,000 | |
| Previous Owner | Valentine Lindsey A | $86,000 |
Source: Public Records
Tax History Compared to Growth
Tax History
| Year | Tax Paid | Tax Assessment Tax Assessment Total Assessment is a certain percentage of the fair market value that is determined by local assessors to be the total taxable value of land and additions on the property. | Land | Improvement |
|---|---|---|---|---|
| 2025 | $6,847 | $576,515 | $335,360 | $241,155 |
| 2024 | $6,847 | $565,212 | $328,785 | $236,427 |
| 2023 | $6,716 | $554,131 | $322,339 | $231,792 |
| 2022 | $6,403 | $543,267 | $316,019 | $227,248 |
| 2021 | $6,316 | $532,616 | $309,823 | $222,793 |
| 2019 | $6,124 | $516,821 | $300,635 | $216,186 |
| 2018 | $6,102 | $506,689 | $294,741 | $211,948 |
| 2016 | $5,826 | $487,016 | $283,297 | $203,719 |
| 2015 | $5,740 | $479,701 | $279,042 | $200,659 |
| 2014 | $5,762 | $470,305 | $273,576 | $196,729 |
Source: Public Records
Map
Nearby Homes
- 10809 Palms Blvd
- 3329 Keystone Ave
- 3321 Keystone Ave
- 3344 Keystone Ave
- 3219 Overland Ave
- 10824 Westminster Ave
- 3231 Cheviot Vista Place
- 3231 Cheviot Vista Place Unit 307
- 10830 Tabor St
- 3127 Glendon Ave
- 3569 Kelton Ave
- 3124 Veteran Ave
- 10980 Palms Blvd Unit 1
- 3265 Military Ave
- 10748 National Blvd
- 3649 Glendon Ave Unit 202
- 3662 Keystone Ave
- 3667 Mentone Ave
- 3315 S Bentley Ave
- 3525 Jasmine Ave
- 10790 Rose Ave
- 10790 Rose Ave Unit 306
- 10790 Rose Ave Unit 109
- 10790 Rose Ave Unit 406
- 10790 Rose Ave Unit 401
- 10790 Rose Ave Unit 302
- 10790 Rose Ave Unit 107
- 10790 Rose Ave Unit 307
- 10790 Rose Ave Unit 209
- 10790 Rose Ave Unit 303
- 10790 Rose Ave Unit 108
- 10790 Rose Ave Unit 201
- 10790 Rose Ave Unit 205
- 10790 Rose Ave Unit 105
- 10790 Rose Ave Unit 102
- 10790 Rose Ave Unit 308
- 10790 Rose Ave Unit 206
- 10790 Rose Ave Unit 101
- 10790 Rose Ave Unit 104
- 10790 Rose Ave Unit 409