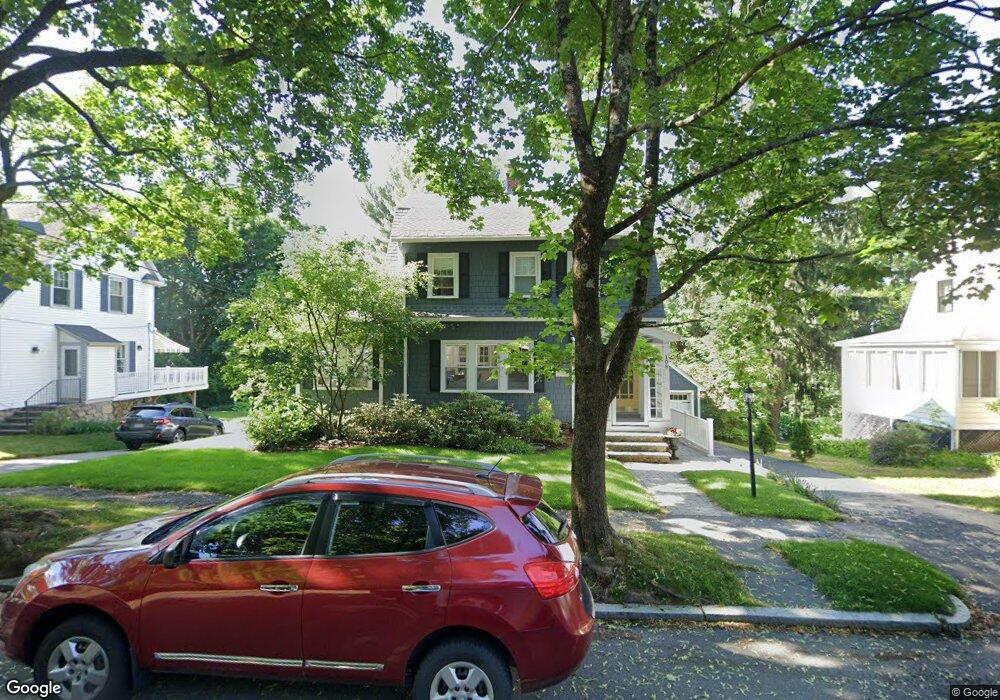
108 Amherst St Worcester, MA 01602
Salisbury Street NeighborhoodEstimated Value: $484,000 - $553,000
3
Beds
2
Baths
1,756
Sq Ft
$288/Sq Ft
Est. Value
About This Home
This home is located at 108 Amherst St, Worcester, MA 01602 and is currently estimated at $506,349, approximately $288 per square foot. 108 Amherst St is a home located in Worcester County with nearby schools including Chandler Magnet, Jacob Hiatt Magnet School, and Midland Street.
Ownership History
Date
Name
Owned For
Owner Type
Purchase Details
Closed on
Jun 30, 2006
Sold by
Sullivan John L and Sullivan Pauline A
Bought by
Caputo Kristine M and Maloney Patrick T
Current Estimated Value
Home Financials for this Owner
Home Financials are based on the most recent Mortgage that was taken out on this home.
Original Mortgage
$243,000
Outstanding Balance
$143,705
Interest Rate
6.58%
Mortgage Type
Purchase Money Mortgage
Estimated Equity
$362,644
Create a Home Valuation Report for This Property
The Home Valuation Report is an in-depth analysis detailing your home's value as well as a comparison with similar homes in the area
Home Values in the Area
Average Home Value in this Area
Purchase History
| Date | Buyer | Sale Price | Title Company |
|---|---|---|---|
| Caputo Kristine M | $270,000 | -- |
Source: Public Records
Mortgage History
| Date | Status | Borrower | Loan Amount |
|---|---|---|---|
| Open | Caputo Kristine M | $243,000 |
Source: Public Records
Tax History Compared to Growth
Tax History
| Year | Tax Paid | Tax Assessment Tax Assessment Total Assessment is a certain percentage of the fair market value that is determined by local assessors to be the total taxable value of land and additions on the property. | Land | Improvement |
|---|---|---|---|---|
| 2025 | $5,221 | $395,800 | $117,700 | $278,100 |
| 2024 | $5,129 | $373,000 | $117,700 | $255,300 |
| 2023 | $4,923 | $343,300 | $102,300 | $241,000 |
| 2022 | $4,540 | $298,500 | $81,800 | $216,700 |
| 2021 | $4,366 | $268,200 | $65,500 | $202,700 |
| 2020 | $4,247 | $249,800 | $65,500 | $184,300 |
| 2019 | $4,095 | $227,500 | $58,900 | $168,600 |
| 2018 | $4,073 | $215,400 | $58,900 | $156,500 |
| 2017 | $3,583 | $186,400 | $58,900 | $127,500 |
| 2016 | $3,504 | $170,000 | $42,800 | $127,200 |
| 2015 | $3,412 | $170,000 | $42,800 | $127,200 |
| 2014 | $3,355 | $171,700 | $42,800 | $128,900 |
Source: Public Records
Map
Nearby Homes