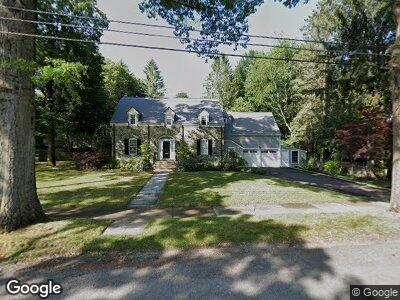
108 Arnold Rd Newton Center, MA 02459
Oak Hill NeighborhoodEstimated Value: $1,966,000 - $2,460,000
4
Beds
5
Baths
3,383
Sq Ft
$633/Sq Ft
Est. Value
About This Home
This home is located at 108 Arnold Rd, Newton Center, MA 02459 and is currently estimated at $2,140,179, approximately $632 per square foot. 108 Arnold Rd is a home located in Middlesex County with nearby schools including Memorial Spaulding Elementary School, Charles E Brown Middle School, and Oak Hill Middle School.
Ownership History
Date
Name
Owned For
Owner Type
Purchase Details
Closed on
Jun 1, 1992
Sold by
Fliegel Berton S and Fleigel Susan J
Bought by
Penzias David S and Penzias Bonnie K
Current Estimated Value
Home Financials for this Owner
Home Financials are based on the most recent Mortgage that was taken out on this home.
Original Mortgage
$275,000
Interest Rate
8.7%
Mortgage Type
Purchase Money Mortgage
Create a Home Valuation Report for This Property
The Home Valuation Report is an in-depth analysis detailing your home's value as well as a comparison with similar homes in the area
Home Values in the Area
Average Home Value in this Area
Purchase History
| Date | Buyer | Sale Price | Title Company |
|---|---|---|---|
| Penzias David S | $465,000 | -- |
Source: Public Records
Mortgage History
| Date | Status | Borrower | Loan Amount |
|---|---|---|---|
| Closed | Penzias David S | $275,000 |
Source: Public Records
Tax History Compared to Growth
Tax History
| Year | Tax Paid | Tax Assessment Tax Assessment Total Assessment is a certain percentage of the fair market value that is determined by local assessors to be the total taxable value of land and additions on the property. | Land | Improvement |
|---|---|---|---|---|
| 2025 | $18,755 | $1,913,800 | $1,184,600 | $729,200 |
| 2024 | $18,135 | $1,858,100 | $1,150,100 | $708,000 |
| 2023 | $17,554 | $1,724,400 | $904,200 | $820,200 |
| 2022 | $16,797 | $1,596,700 | $837,200 | $759,500 |
| 2021 | $16,208 | $1,506,300 | $789,800 | $716,500 |
| 2020 | $15,726 | $1,506,300 | $789,800 | $716,500 |
| 2019 | $15,282 | $1,462,400 | $766,800 | $695,600 |
| 2018 | $15,133 | $1,398,600 | $696,200 | $702,400 |
| 2017 | $14,672 | $1,319,400 | $656,800 | $662,600 |
| 2016 | $14,033 | $1,233,100 | $613,800 | $619,300 |
| 2015 | $13,379 | $1,152,400 | $573,600 | $578,800 |
Source: Public Records
Map
Nearby Homes