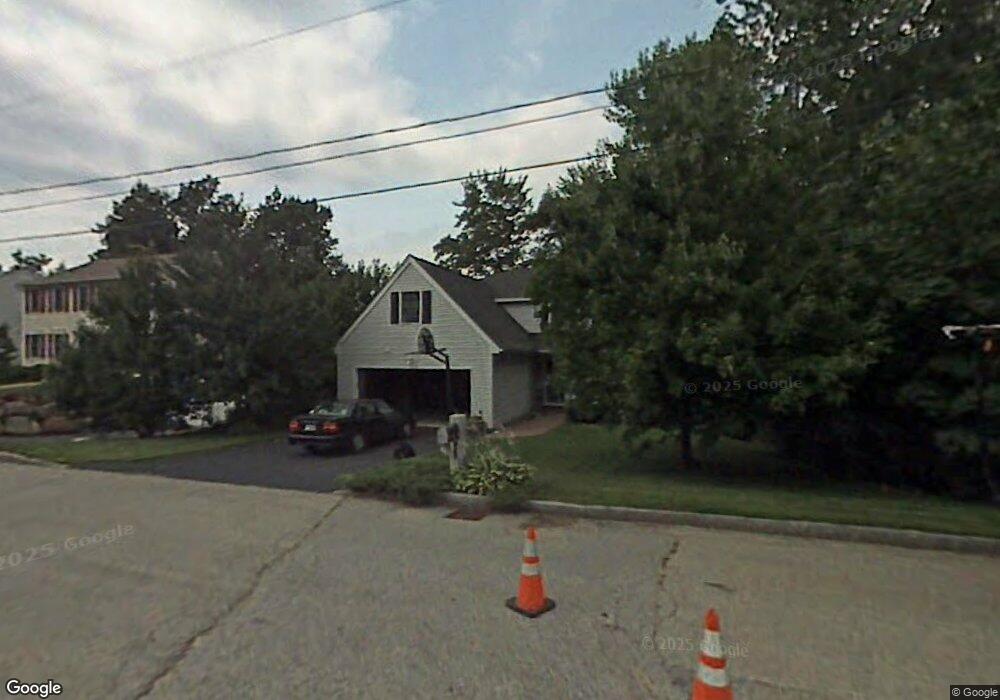
108 Blevens Dr Manchester, NH 03104
Straw-Smyth NeighborhoodEstimated Value: $588,000 - $696,000
4
Beds
4
Baths
2,197
Sq Ft
$290/Sq Ft
Est. Value
About This Home
This home is located at 108 Blevens Dr, Manchester, NH 03104 and is currently estimated at $636,779, approximately $289 per square foot. 108 Blevens Dr is a home located in Hillsborough County with nearby schools including Smyth Road School, Hillside Middle School, and Kreiva Academy Public Charter School (H).
Ownership History
Date
Name
Owned For
Owner Type
Purchase Details
Closed on
Sep 11, 2007
Sold by
Kelley Richard E and Kelley Pauline
Bought by
Paige Christine E
Current Estimated Value
Purchase Details
Closed on
Jul 3, 2002
Sold by
Elesi Anthony O
Bought by
Kelley Richard E and Kelley Pauline
Home Financials for this Owner
Home Financials are based on the most recent Mortgage that was taken out on this home.
Original Mortgage
$204,720
Interest Rate
6.82%
Create a Home Valuation Report for This Property
The Home Valuation Report is an in-depth analysis detailing your home's value as well as a comparison with similar homes in the area
Home Values in the Area
Average Home Value in this Area
Purchase History
| Date | Buyer | Sale Price | Title Company |
|---|---|---|---|
| Paige Christine E | $60,000 | -- | |
| Kelley Richard E | $255,900 | -- |
Source: Public Records
Mortgage History
| Date | Status | Borrower | Loan Amount |
|---|---|---|---|
| Open | Kelley Richard E | $266,200 | |
| Previous Owner | Kelley Richard E | $280,000 | |
| Previous Owner | Kelley Richard E | $204,720 |
Source: Public Records
Tax History Compared to Growth
Tax History
| Year | Tax Paid | Tax Assessment Tax Assessment Total Assessment is a certain percentage of the fair market value that is determined by local assessors to be the total taxable value of land and additions on the property. | Land | Improvement |
|---|---|---|---|---|
| 2024 | $8,365 | $427,200 | $108,300 | $318,900 |
| 2023 | $8,057 | $427,200 | $108,300 | $318,900 |
| 2022 | $7,792 | $427,200 | $108,300 | $318,900 |
| 2021 | $7,553 | $427,200 | $108,300 | $318,900 |
| 2020 | $7,820 | $317,100 | $81,500 | $235,600 |
| 2019 | $7,712 | $317,100 | $81,500 | $235,600 |
| 2018 | $7,423 | $317,100 | $81,500 | $235,600 |
| 2017 | $7,241 | $317,100 | $81,500 | $235,600 |
| 2016 | $7,338 | $317,100 | $81,500 | $235,600 |
| 2015 | $7,030 | $299,900 | $74,700 | $225,200 |
| 2014 | $7,048 | $299,900 | $74,700 | $225,200 |
| 2013 | $6,799 | $299,900 | $74,700 | $225,200 |
Source: Public Records
Map
Nearby Homes