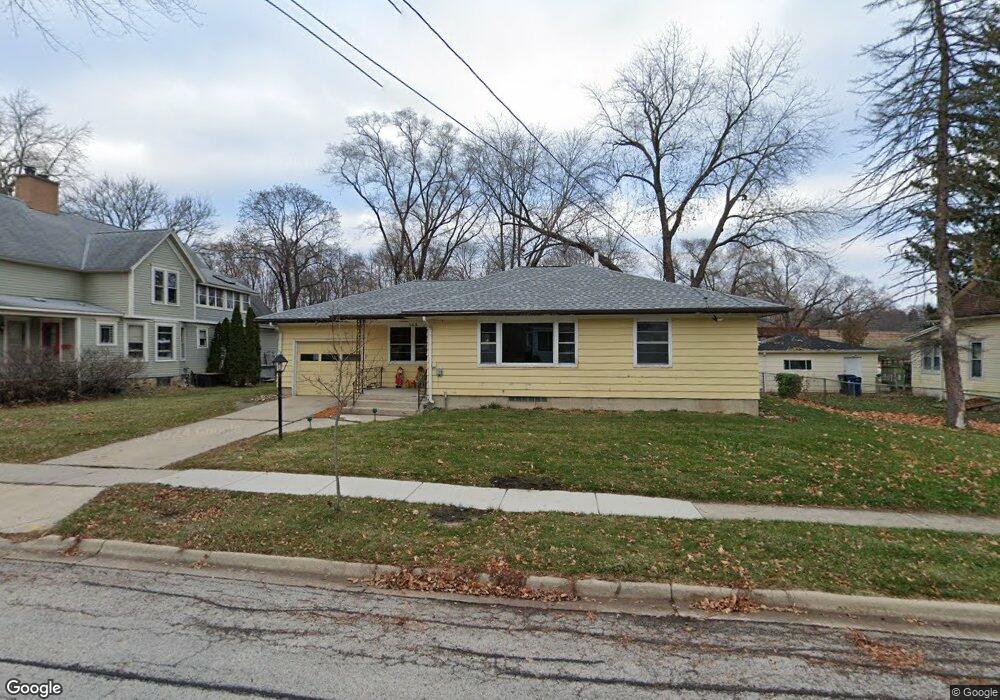
108 Division St Algonquin, IL 60102
Estimated Value: $275,074 - $384,000
Studio
--
Bath
1,420
Sq Ft
$230/Sq Ft
Est. Value
About This Home
This home is located at 108 Division St, Algonquin, IL 60102 and is currently estimated at $327,019, approximately $230 per square foot. 108 Division St is a home located in McHenry County with nearby schools including Eastview Elementary School, Algonquin Middle School, and Dundee-Crown High School.
Ownership History
Date
Name
Owned For
Owner Type
Purchase Details
Closed on
Sep 18, 2017
Sold by
Weyers Thomas Robert and Lively Debra Jean
Bought by
Weyers Thomas Robert and Lively Weyers Debra Jean
Current Estimated Value
Home Financials for this Owner
Home Financials are based on the most recent Mortgage that was taken out on this home.
Original Mortgage
$85,000
Outstanding Balance
$70,693
Interest Rate
3.75%
Mortgage Type
New Conventional
Estimated Equity
$256,326
Purchase Details
Closed on
Aug 17, 2010
Sold by
Krueger Spencer M
Bought by
Weyers Thomas Robert and Lively Debra Jean
Home Financials for this Owner
Home Financials are based on the most recent Mortgage that was taken out on this home.
Original Mortgage
$105,000
Interest Rate
4.54%
Mortgage Type
New Conventional
Purchase Details
Closed on
Sep 22, 2008
Sold by
Krueger Pearl M and Krueger Milton A
Bought by
Krueger Spencer M and Pearl M Krueger Trust
Create a Home Valuation Report for This Property
The Home Valuation Report is an in-depth analysis detailing your home's value as well as a comparison with similar homes in the area
Purchase History
| Date | Buyer | Sale Price | Title Company |
|---|---|---|---|
| Weyers Thomas Robert | -- | First American Title | |
| Weyers Thomas Robert | $140,000 | Fox Title Company | |
| Krueger Spencer M | -- | None Available |
Source: Public Records
Mortgage History
| Date | Status | Borrower | Loan Amount |
|---|---|---|---|
| Open | Weyers Thomas Robert | $85,000 | |
| Closed | Weyers Thomas Robert | $105,000 |
Source: Public Records
Tax History
| Year | Tax Paid | Tax Assessment Tax Assessment Total Assessment is a certain percentage of the fair market value that is determined by local assessors to be the total taxable value of land and additions on the property. | Land | Improvement |
|---|---|---|---|---|
| 2024 | $5,996 | $76,643 | $20,234 | $56,409 |
| 2023 | $5,738 | $68,548 | $18,097 | $50,451 |
| 2022 | $4,697 | $54,769 | $11,178 | $43,591 |
| 2021 | $4,528 | $51,024 | $10,414 | $40,610 |
| 2020 | $4,419 | $49,217 | $10,045 | $39,172 |
| 2019 | $4,325 | $47,106 | $9,614 | $37,492 |
| 2018 | $4,148 | $43,516 | $8,881 | $34,635 |
| 2017 | $3,485 | $40,994 | $8,366 | $32,628 |
| 2016 | $3,412 | $38,449 | $7,847 | $30,602 |
| 2013 | -- | $36,629 | $7,321 | $29,308 |
Source: Public Records
Map
Nearby Homes
- 21 Division St
- 407 La Fox River Dr
- 108 La Fox Dr
- 0 River Dr N Unit MRD12473279
- 1200 Hillside View
- 615 Harper Dr
- Lot #3-5 Hayes Rd
- 600 E Algonquin Rd
- 719 Webster St
- 0 Natoma Trail
- 953 Old Oak Cir
- 1188 E Algonquin Rd
- 19N963 Manito Trail
- lot 25 Wabican Trail
- 313 Bayberry Dr
- SWC Talaga and Algonquin Rd
- 9 Echowood Dr
- 909 Roger St
- Lot 4 b Ryan Pkwy
- 1770 E Algonquin Rd
- 114 Division St
- 102 Division St
- 604 La Fox River Dr
- 120 Division St Unit 3
- 109 Division St
- 115 Division St
- 103 Division St
- 32 Division St
- 126 Division St
- 121 Division St
- 127 Division St
- 703 La Fox River Dr
- 26 Division St
- 605 La Fox River Dr
- 721 S Main St
- 108 Center St
- 132 Division St
- 438 La Fox River Dr
- 27 Division St
- 445 La Fox River Dr
Your Personal Tour Guide
Ask me questions while you tour the home.