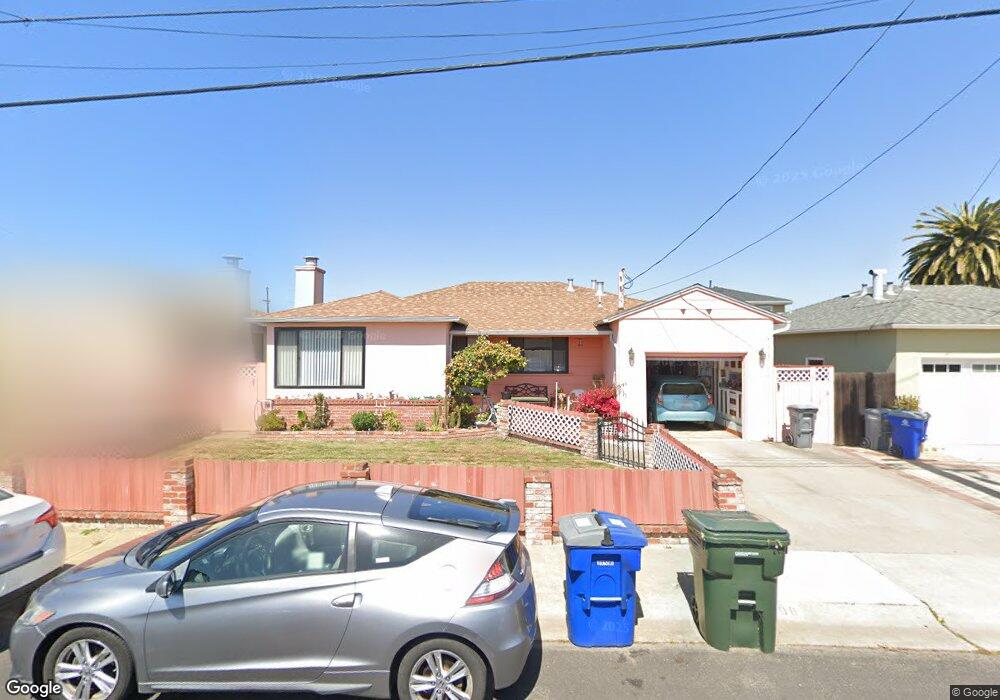
108 Fir Ave South San Francisco, CA 94080
Orange Park NeighborhoodEstimated Value: $1,184,000 - $1,272,000
3
Beds
1
Bath
1,280
Sq Ft
$966/Sq Ft
Est. Value
About This Home
This home is located at 108 Fir Ave, South San Francisco, CA 94080 and is currently estimated at $1,236,831, approximately $966 per square foot. 108 Fir Ave is a home located in San Mateo County with nearby schools including Los Cerritos Elementary School, Alta Loma Middle School, and South San Francisco High School.
Ownership History
Date
Name
Owned For
Owner Type
Purchase Details
Closed on
Oct 3, 2023
Sold by
Ryzanych Carolyn Lara and Ryzanych Paul
Bought by
Ryzanych Family Trust and Ryzanych
Current Estimated Value
Home Financials for this Owner
Home Financials are based on the most recent Mortgage that was taken out on this home.
Original Mortgage
$481,450
Outstanding Balance
$471,983
Interest Rate
7.12%
Mortgage Type
New Conventional
Estimated Equity
$764,848
Purchase Details
Closed on
Sep 1, 2023
Sold by
Lydia Lara & Carlos G Lara Sr Revocable and Ryzanych Carolyn
Bought by
Ryzanych Carolyn and Lara Carlos G
Home Financials for this Owner
Home Financials are based on the most recent Mortgage that was taken out on this home.
Original Mortgage
$481,450
Outstanding Balance
$471,983
Interest Rate
7.12%
Mortgage Type
New Conventional
Estimated Equity
$764,848
Purchase Details
Closed on
Mar 25, 2009
Sold by
Lara Lydia and Lara Carlos G
Bought by
Lara Lydia and Lara Carlos G
Create a Home Valuation Report for This Property
The Home Valuation Report is an in-depth analysis detailing your home's value as well as a comparison with similar homes in the area
Home Values in the Area
Average Home Value in this Area
Purchase History
| Date | Buyer | Sale Price | Title Company |
|---|---|---|---|
| Ryzanych Family Trust | $475,000 | Boston National Title Agency | |
| Ryzanych Carolyn | -- | None Listed On Document | |
| Lara Lydia | -- | None Available |
Source: Public Records
Mortgage History
| Date | Status | Borrower | Loan Amount |
|---|---|---|---|
| Open | Ryzanych Family Trust | $481,450 |
Source: Public Records
Tax History Compared to Growth
Tax History
| Year | Tax Paid | Tax Assessment Tax Assessment Total Assessment is a certain percentage of the fair market value that is determined by local assessors to be the total taxable value of land and additions on the property. | Land | Improvement |
|---|---|---|---|---|
| 2025 | $11,340 | $989,400 | $775,200 | $214,200 |
| 2023 | $11,340 | $87,151 | $21,188 | $65,963 |
| 2022 | $1,640 | $85,443 | $20,773 | $64,670 |
| 2021 | $1,612 | $83,768 | $20,366 | $63,402 |
| 2020 | $1,588 | $82,910 | $20,158 | $62,752 |
| 2019 | $1,577 | $81,285 | $19,763 | $61,522 |
| 2018 | $1,541 | $79,692 | $19,376 | $60,316 |
| 2017 | $1,464 | $78,131 | $18,997 | $59,134 |
| 2016 | $1,367 | $76,600 | $18,625 | $57,975 |
| 2015 | $1,341 | $75,451 | $18,346 | $57,105 |
| 2014 | $1,302 | $73,974 | $17,987 | $55,987 |
Source: Public Records
Map
Nearby Homes
- 632 1st Ln
- 645 Baden Ave Unit 4
- 719 Circle Ct
- 20 Maple Ave
- 453 Grand Ave
- 311 Magnolia Ave
- 573 Miller Ave
- 577 Miller Ave
- 322 Commercial Ave
- 729 Grand Ave
- 400 Miller Ave
- 219 Miller Ave
- 728 Cottonwood Ave
- 247 Rainier Ave
- 553 Diamond Ave
- 214 Manor Dr
- 69 Atlantic Ave
- 56 Scott St
- 1078 Montgomery Ave
- 829 Stonegate Dr