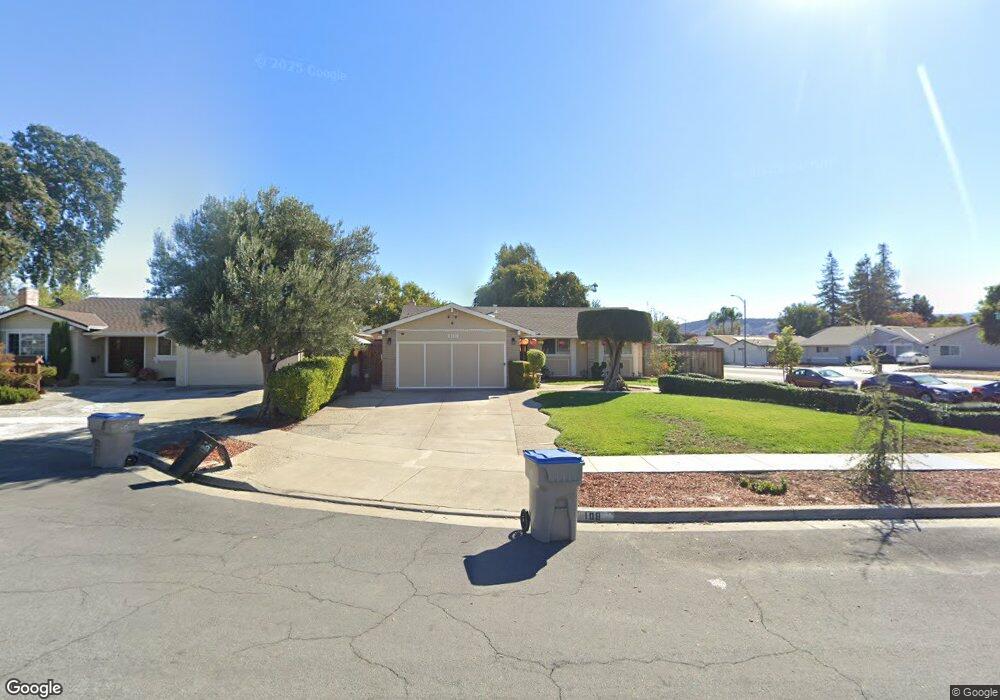
108 Lime Blossom Ct San Jose, CA 95123
Hayes NeighborhoodEstimated Value: $1,387,009 - $1,547,000
3
Beds
2
Baths
1,536
Sq Ft
$953/Sq Ft
Est. Value
About This Home
This home is located at 108 Lime Blossom Ct, San Jose, CA 95123 and is currently estimated at $1,463,752, approximately $952 per square foot. 108 Lime Blossom Ct is a home located in Santa Clara County with nearby schools including Hayes Elementary School, Davis (Caroline) Intermediate School, and Oak Grove High School.
Ownership History
Date
Name
Owned For
Owner Type
Purchase Details
Closed on
Sep 26, 2022
Sold by
Tran Nhan H and Tran Ngoc
Bought by
Nhan Tran Family Revocable Living Trust
Current Estimated Value
Purchase Details
Closed on
Aug 2, 2007
Sold by
Tran Nhan H
Bought by
Tran Nhan H and Tran Ngoc
Home Financials for this Owner
Home Financials are based on the most recent Mortgage that was taken out on this home.
Original Mortgage
$528,000
Interest Rate
7.37%
Mortgage Type
New Conventional
Purchase Details
Closed on
May 13, 2005
Sold by
Tran Nhan H and Tran Nhan Hieu
Bought by
Tran Nhan H
Home Financials for this Owner
Home Financials are based on the most recent Mortgage that was taken out on this home.
Original Mortgage
$517,500
Interest Rate
1%
Mortgage Type
Negative Amortization
Purchase Details
Closed on
Mar 15, 2004
Sold by
Tran Nhungoc
Bought by
Tran Nhan Hieu
Home Financials for this Owner
Home Financials are based on the most recent Mortgage that was taken out on this home.
Original Mortgage
$404,000
Interest Rate
3.95%
Mortgage Type
Purchase Money Mortgage
Purchase Details
Closed on
Dec 11, 2003
Sold by
Tran Tu Hung
Bought by
Tran Tu Hung and Tran Nhan Hieli
Purchase Details
Closed on
Nov 16, 2001
Sold by
Mock Annie
Bought by
Tran Tin Hung
Home Financials for this Owner
Home Financials are based on the most recent Mortgage that was taken out on this home.
Original Mortgage
$310,000
Interest Rate
6.5%
Purchase Details
Closed on
Nov 12, 2001
Sold by
Tran Tin Hung
Bought by
Tran Tu Hung
Home Financials for this Owner
Home Financials are based on the most recent Mortgage that was taken out on this home.
Original Mortgage
$310,000
Interest Rate
6.5%
Purchase Details
Closed on
Sep 5, 2001
Sold by
Tran Tin Hung
Bought by
Hung Tran Tin and Tran Tu Hung
Purchase Details
Closed on
Jan 22, 2000
Sold by
Tran Lan N
Bought by
Tran Tin Hung
Purchase Details
Closed on
Feb 17, 1999
Sold by
Tran Lan N and Tran Hanh H
Bought by
Tran Lan N
Home Financials for this Owner
Home Financials are based on the most recent Mortgage that was taken out on this home.
Original Mortgage
$234,750
Interest Rate
6.77%
Purchase Details
Closed on
Nov 7, 1995
Sold by
Tran Lan N and Truong Tuan Chi
Bought by
Tran Lan N and Tran Hanh H
Home Financials for this Owner
Home Financials are based on the most recent Mortgage that was taken out on this home.
Original Mortgage
$186,000
Interest Rate
7.62%
Create a Home Valuation Report for This Property
The Home Valuation Report is an in-depth analysis detailing your home's value as well as a comparison with similar homes in the area
Home Values in the Area
Average Home Value in this Area
Purchase History
| Date | Buyer | Sale Price | Title Company |
|---|---|---|---|
| Nhan Tran Family Revocable Living Trust | -- | -- | |
| Tran Nhan H | -- | Alliance Title Company | |
| Tran Nhan H | -- | Stewart Title Of California | |
| Tran Nhan Hieu | -- | Old Republic Title Company | |
| Tran Nhan Hieu | -- | Old Republic Title Company | |
| Tran Tu Hung | -- | Chicago Title Co | |
| Tran Tin Hung | -- | Chicago Title Co | |
| Tran Tu Hung | -- | Chicago Title Co | |
| Hung Tran Tin | -- | -- | |
| Tran Tin Hung | -- | -- | |
| Tran Lan N | -- | Financial Title Company | |
| Tran Lan N | $141,000 | Stewart Title |
Source: Public Records
Mortgage History
| Date | Status | Borrower | Loan Amount |
|---|---|---|---|
| Previous Owner | Tran Nhan H | $528,000 | |
| Previous Owner | Tran Nhan H | $517,500 | |
| Previous Owner | Tran Nhan Hieu | $404,000 | |
| Previous Owner | Tran Tu Hung | $310,000 | |
| Previous Owner | Tran Lan N | $234,750 | |
| Previous Owner | Tran Lan N | $186,000 |
Source: Public Records
Tax History Compared to Growth
Tax History
| Year | Tax Paid | Tax Assessment Tax Assessment Total Assessment is a certain percentage of the fair market value that is determined by local assessors to be the total taxable value of land and additions on the property. | Land | Improvement |
|---|---|---|---|---|
| 2025 | $10,899 | $767,748 | $483,400 | $284,348 |
| 2024 | $10,899 | $752,695 | $473,922 | $278,773 |
| 2023 | $11,633 | $737,937 | $464,630 | $273,307 |
| 2022 | $10,665 | $723,469 | $455,520 | $267,949 |
| 2021 | $10,506 | $709,285 | $446,589 | $262,696 |
| 2020 | $10,275 | $702,013 | $442,010 | $260,003 |
| 2019 | $10,036 | $688,249 | $433,344 | $254,905 |
| 2018 | $9,968 | $674,755 | $424,848 | $249,907 |
| 2017 | $10,136 | $661,525 | $416,518 | $245,007 |
| 2016 | $9,360 | $648,554 | $408,351 | $240,203 |
| 2015 | $10,417 | $638,813 | $402,218 | $236,595 |
| 2014 | $8,479 | $556,000 | $350,100 | $205,900 |
Source: Public Records
Map
Nearby Homes
- 122 Jaybee Place
- 66 Cherry Ridge Ln
- 40 Cherry Crest Ln
- 196 Coy Dr Unit 1
- 201 Pecan Grove Ct
- 510 Saddlebrook Dr Unit 276
- 510 Saddlebrook Dr Unit 308
- 510 Saddlebrook Dr Unit 315
- 5503 Eagles Ln Unit 2
- 510 Saddle Brook Dr Unit 122
- 510 Saddle Brook Dr Unit 322
- 224 Coy Dr Unit 1
- 71 Hayes Ave
- 5532 Spinnaker Dr Unit 2
- 4968 Red Creek Dr
- 323 Blossom Hill Rd Unit 2
- 285 Tradewinds Dr Unit 6
- 329 Blossom Hill Rd Unit 4
- 4974 Flat Rock Cir
- 291 Tradewinds Dr Unit 7
- 106 Lime Blossom Ct
- 113 Cashew Blossom Dr
- 104 Lime Blossom Ct
- 111 Cashew Blossom Dr
- 5342 Larch Grove Place
- 109 Lime Blossom Ct
- 5351 Lean Ave
- 107 Lime Blossom Ct
- 105 Lime Blossom Ct
- 109 Cashew Blossom Dr
- 103 Lime Blossom Ct
- 119 Ash Grove Ct
- 5348 Larch Grove Place
- 88 Pear Blossom Ct
- 5354 Larch Grove Place
- 123 Ash Grove Ct
- 5336 Larch Grove Place
- 107 Cashew Blossom Dr
- 86 Pear Blossom Ct
- 112 Cashew Blossom Dr