Estimated Value: $144,000 - $269,000
3
Beds
2
Baths
1,040
Sq Ft
$190/Sq Ft
Est. Value
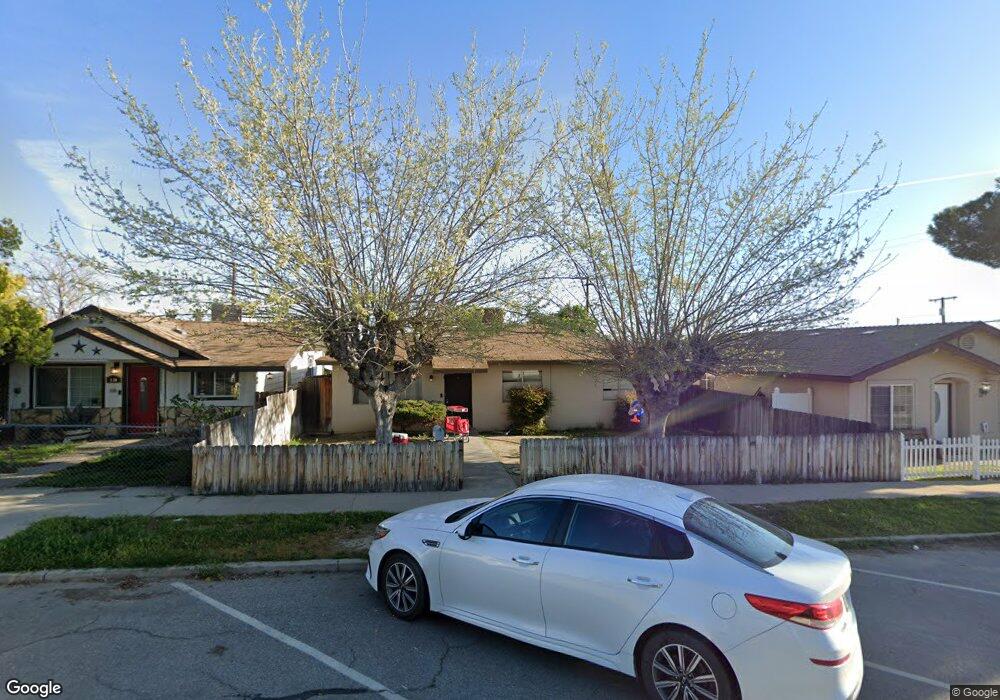
About This Home
This home is located at 108 Lucard St, Taft, CA 93268 and is currently estimated at $197,647, approximately $190 per square foot. 108 Lucard St is a home located in Kern County with nearby schools including Taft Primary School, Roosevelt Elementary School, and Lincoln Junior High School.
Ownership History
Date
Name
Owned For
Owner Type
Purchase Details
Closed on
Feb 27, 2026
Sold by
Summer Sheffield
Bought by
Gebarah Joy
Current Estimated Value
Home Financials for this Owner
Home Financials are based on the most recent Mortgage that was taken out on this home.
Original Mortgage
$165,000
Outstanding Balance
$165,000
Interest Rate
6.09%
Mortgage Type
Seller Take Back
Estimated Equity
$32,647
Purchase Details
Closed on
Feb 23, 2026
Sold by
Alex Sheffield
Bought by
Sheffield Alex
Home Financials for this Owner
Home Financials are based on the most recent Mortgage that was taken out on this home.
Original Mortgage
$165,000
Outstanding Balance
$165,000
Interest Rate
6.09%
Mortgage Type
Seller Take Back
Estimated Equity
$32,647
Purchase Details
Closed on
Sep 15, 2025
Sold by
Christina Yc Payne Revocable Living Trus and Payne-Strand Dominique D
Bought by
Sheffield Alex
Purchase Details
Closed on
May 11, 2009
Sold by
Payne Christina Y C
Bought by
Payne Christina Y C and The Christina Y C Payne Revoca
Purchase Details
Closed on
Mar 16, 2007
Sold by
Payne Kenneth E and Payne Christina Y C
Bought by
Payne Christina Y C
Purchase Details
Closed on
Jun 8, 2005
Sold by
Payne Kenneth E and Payne Christina Y C
Bought by
Payne Kenneth E and Payne Christina Y C
Purchase Details
Closed on
Sep 14, 2001
Sold by
Va
Bought by
Shown Donald W and Shown Roslyn
Purchase Details
Closed on
Aug 31, 2001
Sold by
Shown Donald W
Bought by
Payne Kenneth E and Payne Christina Y C
Create a Home Valuation Report for This Property
The Home Valuation Report is an in-depth analysis detailing your home's value as well as a comparison with similar homes in the area
Home Values in the Area
Average Home Value in this Area
Purchase History
| Date | Buyer | Sale Price | Title Company |
|---|---|---|---|
| Gebarah Joy | -- | Chicago Title Company | |
| Sheffield Alex | -- | Chicago Title Company | |
| Ramirez Rita | $240,000 | Chicago Title Company | |
| Sheffield Alex | -- | Chicago Title Company | |
| Sheffield Alex | $145,000 | Chicago Title Company | |
| Payne Christina Y C | -- | None Available | |
| Payne Christina Y C | -- | None Available | |
| Payne Kenneth E | -- | -- | |
| Shown Donald W | -- | Fidelity National Title | |
| Payne Kenneth E | $39,000 | Fidelity National Title Co |
Source: Public Records
Mortgage History
| Date | Status | Borrower | Loan Amount |
|---|---|---|---|
| Open | Ramirez Rita | $165,000 |
Source: Public Records
Tax History
| Year | Tax Paid | Tax Assessment Tax Assessment Total Assessment is a certain percentage of the fair market value that is determined by local assessors to be the total taxable value of land and additions on the property. | Land | Improvement |
|---|---|---|---|---|
| 2025 | $1,969 | $202,980 | $51,000 | $151,980 |
| 2024 | $1,804 | $56,458 | $21,713 | $34,745 |
| 2023 | $1,804 | $55,352 | $21,288 | $34,064 |
| 2022 | $1,676 | $54,268 | $20,871 | $33,397 |
| 2021 | $1,541 | $53,205 | $20,462 | $32,743 |
| 2020 | $1,347 | $52,661 | $20,253 | $32,408 |
| 2019 | $1,336 | $52,661 | $20,253 | $32,408 |
| 2018 | $1,321 | $50,617 | $19,467 | $31,150 |
| 2017 | $1,298 | $49,626 | $19,086 | $30,540 |
| 2016 | $1,298 | $48,654 | $18,712 | $29,942 |
| 2015 | $1,203 | $47,924 | $18,431 | $29,493 |
| 2014 | $1,132 | $46,986 | $18,070 | $28,916 |
Source: Public Records
Map
Nearby Homes
- 108 Lucard St
- 110 Lucard St
- 110 Lucard St
- 505 1st St
- 112 Lucard St
- 112 Lucard St
- 106 Lucard St
- 114 Lucard St
- 122 1/2 Lucard St
- 511 1st St
- 105 San Emidio St
- 105 San Emidio St
- 126 Lucard St
- 107 San Emidio St
- 107 San Emidio St
- 100 E Lucard St
- 105 Lucard St
- 105 Lucard St Unit 5
- 105 Lucard St
- 124 Lucard St
Your Personal Tour Guide
Ask me questions while you tour the home.