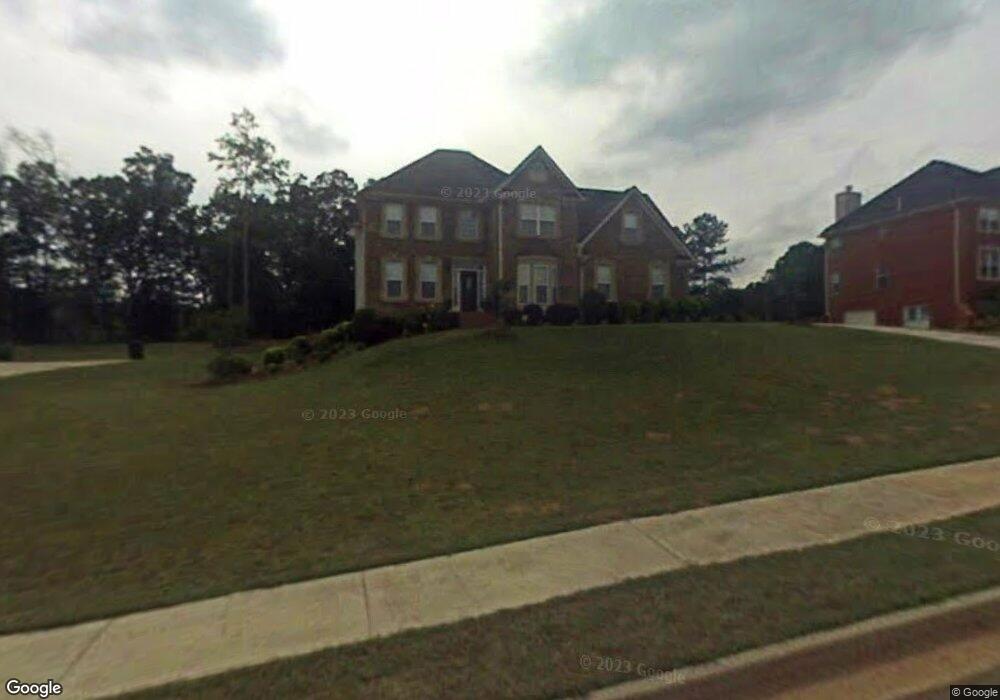
108 Lumby Ln Stockbridge, GA 30281
Estimated Value: $469,322 - $564,000
4
Beds
4
Baths
3,297
Sq Ft
$156/Sq Ft
Est. Value
About This Home
This home is located at 108 Lumby Ln, Stockbridge, GA 30281 and is currently estimated at $514,081, approximately $155 per square foot. 108 Lumby Ln is a home located in Henry County with nearby schools including Fairview Elementary School, Austin Road Middle School, and Stockbridge High School.
Ownership History
Date
Name
Owned For
Owner Type
Purchase Details
Closed on
May 10, 2010
Sold by
Sesay Karen M
Bought by
Sesay Bockarie and Sesay Karen M
Current Estimated Value
Home Financials for this Owner
Home Financials are based on the most recent Mortgage that was taken out on this home.
Original Mortgage
$326,151
Outstanding Balance
$216,705
Interest Rate
5.03%
Mortgage Type
VA
Estimated Equity
$297,376
Purchase Details
Closed on
Mar 30, 2006
Sold by
Wells Fargo Natl Assoc
Bought by
Sesay Bockarie
Home Financials for this Owner
Home Financials are based on the most recent Mortgage that was taken out on this home.
Original Mortgage
$335,050
Interest Rate
6.31%
Mortgage Type
VA
Purchase Details
Closed on
Dec 6, 2005
Sold by
Lemon Kanika
Bought by
Sabr 2004-Opi Mortgage Pass-Th
Purchase Details
Closed on
Nov 19, 2003
Sold by
Dalyn Inc
Bought by
Lemon Kanika
Home Financials for this Owner
Home Financials are based on the most recent Mortgage that was taken out on this home.
Original Mortgage
$316,255
Interest Rate
8.3%
Mortgage Type
New Conventional
Create a Home Valuation Report for This Property
The Home Valuation Report is an in-depth analysis detailing your home's value as well as a comparison with similar homes in the area
Home Values in the Area
Average Home Value in this Area
Purchase History
| Date | Buyer | Sale Price | Title Company |
|---|---|---|---|
| Sesay Bockarie | -- | -- | |
| Sesay Bockarie | $328,000 | -- | |
| Sabr 2004-Opi Mortgage Pass-Th | $300,000 | -- | |
| Lemon Kanika | $332,900 | -- |
Source: Public Records
Mortgage History
| Date | Status | Borrower | Loan Amount |
|---|---|---|---|
| Open | Sesay Bockarie | $326,151 | |
| Previous Owner | Sesay Bockarie | $335,050 | |
| Previous Owner | Lemon Kanika | $316,255 |
Source: Public Records
Tax History Compared to Growth
Tax History
| Year | Tax Paid | Tax Assessment Tax Assessment Total Assessment is a certain percentage of the fair market value that is determined by local assessors to be the total taxable value of land and additions on the property. | Land | Improvement |
|---|---|---|---|---|
| 2025 | $4,815 | $202,088 | $22,000 | $180,088 |
| 2024 | $4,815 | $195,840 | $22,000 | $173,840 |
| 2023 | $3,795 | $184,480 | $16,000 | $168,480 |
| 2022 | $4,945 | $150,480 | $16,000 | $134,480 |
| 2021 | $5,009 | $136,560 | $16,000 | $120,560 |
| 2020 | $4,529 | $122,960 | $12,000 | $110,960 |
| 2019 | $4,175 | $113,720 | $12,000 | $101,720 |
| 2018 | $4,035 | $110,080 | $12,000 | $98,080 |
| 2016 | $3,915 | $106,960 | $12,000 | $94,960 |
| 2015 | $3,660 | $97,720 | $10,000 | $87,720 |
| 2014 | $3,660 | $96,720 | $10,000 | $86,720 |
Source: Public Records
Map
Nearby Homes
- 208 Pauline Place
- 40 Lake Ct
- 313 Ashborough Place
- 204 Benefield Ct
- 565 Patillo Rd
- 491 Thurman Rd Unit TRACT C
- 1080 Gardner Rd
- 216 Johns Creek Ln
- 200 Johns Creek Ln
- 145 Glenloch Pkwy
- 130 Fairview Dr
- 2132 E Atlanta Rd
- 125 Bob White Dr
- 106 Bob White Dr
- 500 Saint Sambar Dr
- 429 Saint Surrey Way
- 105 Bobolink Dr
- 154 Johns Creek Ln
- 106 Garden Trail
- 453 Azalea Dr
- 112 Lumby Ln
- 104 Lumby Ln
- 261 Gucci Cir
- 107 Lumby Ln
- 116 Lumby Ln
- 100 Lumby Ln
- 257 Gucci Cir Unit LOT 5
- 257 Gucci Cir
- 265 Gucci Cir
- 0 Pauline Place Unit 8759463
- 0 Pauline Place Unit 7025747
- 0 Pauline Place
- 101 Lumby Ln
- 873 Fairview Rd
- 200 Pauline Place
- 120 Lumby Ln
- 205 Pauline Place
- 253 Gucci Cir Unit LOT 4
- 253 Gucci Cir
- 204 Pauline Place