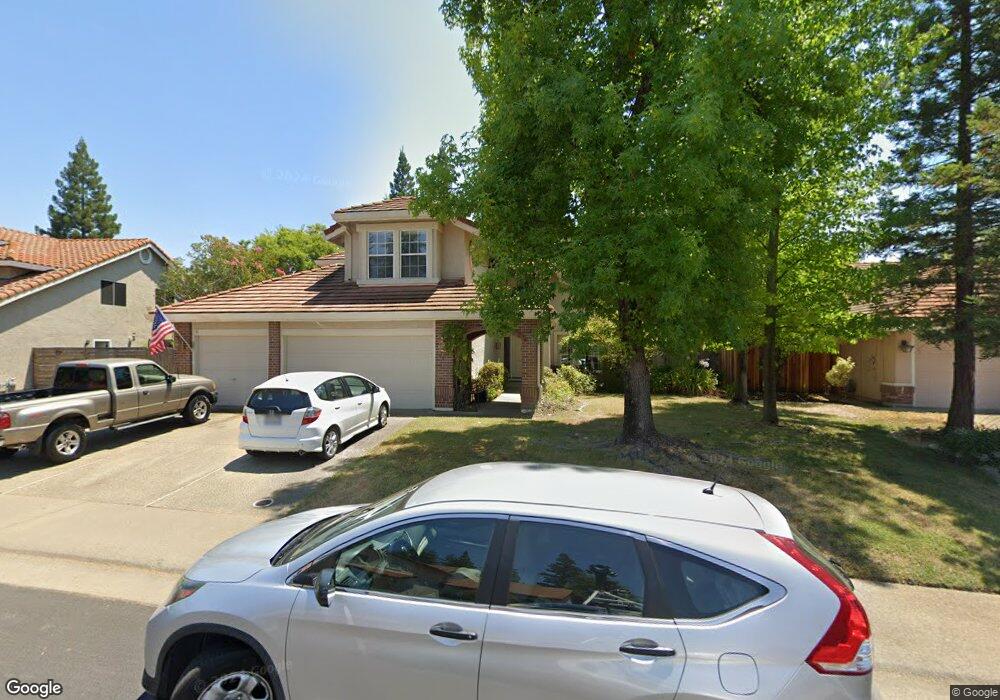
108 Surbaugh Square Folsom, CA 95630
Willow Creek Estates South NeighborhoodEstimated Value: $802,000 - $831,000
4
Beds
3
Baths
2,256
Sq Ft
$362/Sq Ft
Est. Value
About This Home
This home is located at 108 Surbaugh Square, Folsom, CA 95630 and is currently estimated at $817,590, approximately $362 per square foot. 108 Surbaugh Square is a home located in Sacramento County with nearby schools including Oak Chan Elementary School, Folsom Middle School, and Vista Del Lago High School.
Ownership History
Date
Name
Owned For
Owner Type
Purchase Details
Closed on
May 10, 2011
Sold by
Villata Mark Louis
Bought by
Villata Mark L and 2008 Mark L Villata Revocable
Current Estimated Value
Purchase Details
Closed on
Nov 1, 2010
Sold by
Villata Mark L and 2008 Mark L Villata Revocable
Bought by
Villata Mark L
Purchase Details
Closed on
Jun 16, 2008
Sold by
Villata Mark Louis
Bought by
Villata Mark L and 2008 Mark L Villata Revocable
Purchase Details
Closed on
Oct 12, 2004
Sold by
Villata Julie Dawn
Bought by
Villata Mark Louis
Home Financials for this Owner
Home Financials are based on the most recent Mortgage that was taken out on this home.
Original Mortgage
$315,000
Interest Rate
5.74%
Mortgage Type
New Conventional
Purchase Details
Closed on
Oct 5, 1993
Sold by
Martin Larry L H and Martin Marian F
Bought by
Villata Mark Louis and Villata Julie Dawn
Home Financials for this Owner
Home Financials are based on the most recent Mortgage that was taken out on this home.
Original Mortgage
$174,000
Interest Rate
6.95%
Create a Home Valuation Report for This Property
The Home Valuation Report is an in-depth analysis detailing your home's value as well as a comparison with similar homes in the area
Home Values in the Area
Average Home Value in this Area
Purchase History
| Date | Buyer | Sale Price | Title Company |
|---|---|---|---|
| Villata Mark L | -- | None Available | |
| Villata Mark L | -- | None Available | |
| Villata Mark L | -- | None Available | |
| Villata Mark Louis | -- | Fidelity National Title Co | |
| Villata Mark Louis | $217,500 | Chicago Title Company |
Source: Public Records
Mortgage History
| Date | Status | Borrower | Loan Amount |
|---|---|---|---|
| Closed | Villata Mark Louis | $315,000 | |
| Closed | Villata Mark Louis | $174,000 |
Source: Public Records
Tax History
| Year | Tax Paid | Tax Assessment Tax Assessment Total Assessment is a certain percentage of the fair market value that is determined by local assessors to be the total taxable value of land and additions on the property. | Land | Improvement |
|---|---|---|---|---|
| 2025 | $4,255 | $395,151 | $110,466 | $284,685 |
| 2024 | $4,255 | $387,403 | $108,300 | $279,103 |
| 2023 | $4,180 | $379,808 | $106,177 | $273,631 |
| 2022 | $4,119 | $372,362 | $104,096 | $268,266 |
| 2021 | $4,064 | $365,061 | $102,055 | $263,006 |
| 2020 | $4,014 | $361,319 | $101,009 | $260,310 |
| 2019 | $3,948 | $354,235 | $99,029 | $255,206 |
| 2018 | $3,851 | $347,290 | $97,088 | $250,202 |
| 2017 | $3,598 | $340,482 | $95,185 | $245,297 |
| 2016 | $3,753 | $333,807 | $93,319 | $240,488 |
| 2015 | $3,629 | $328,794 | $91,918 | $236,876 |
| 2014 | $3,449 | $322,354 | $90,118 | $232,236 |
Source: Public Records
Map
Nearby Homes
- 232 Silberhorn Dr
- 762 Glen-Mady Way
- 703 Glen-Mady Way
- 337 Silberhorn Dr
- 177 Dulverton Cir
- 101 Duxbury Way
- 639 Hillswick Cir
- 652 Glen-Mady Way
- 703 Morningside Ct
- 753 Rodmartin Ct
- 1600 Manasco Cir
- 757 Hatherden Ct
- 833 Fairchild Ct
- 1729 Traziel Way
- 1121 Elderberry Cir
- 743 Moylegrove Ct
- 1484 Willow Bend Rd
- 1114 Kidder Way
- 392 Creach Ct
- 1160 Cobblefields Ct
- 110 Surbaugh Square
- 106 Surbaugh Square
- 111 Swain Square
- 113 Swain Square
- 112 Surbaugh Square
- 109 Swain Square
- 104 Surbaugh Square
- 115 Swain Square
- 109 Surbaugh Square
- 105 Surbaugh Square
- 107 Swain Square
- 117 Swain Square
- 111 Surbaugh Square
- 102 Surbaugh Square
- 103 Surbaugh Square
- 105 Swain Square
- 110 Swain Square
- 469 S Lexington Dr
- 108 Swain Square
- 112 Swain Square
Your Personal Tour Guide
Ask me questions while you tour the home.