Estimated Value: $319,000 - $338,000
3
Beds
3
Baths
2,100
Sq Ft
$157/Sq Ft
Est. Value
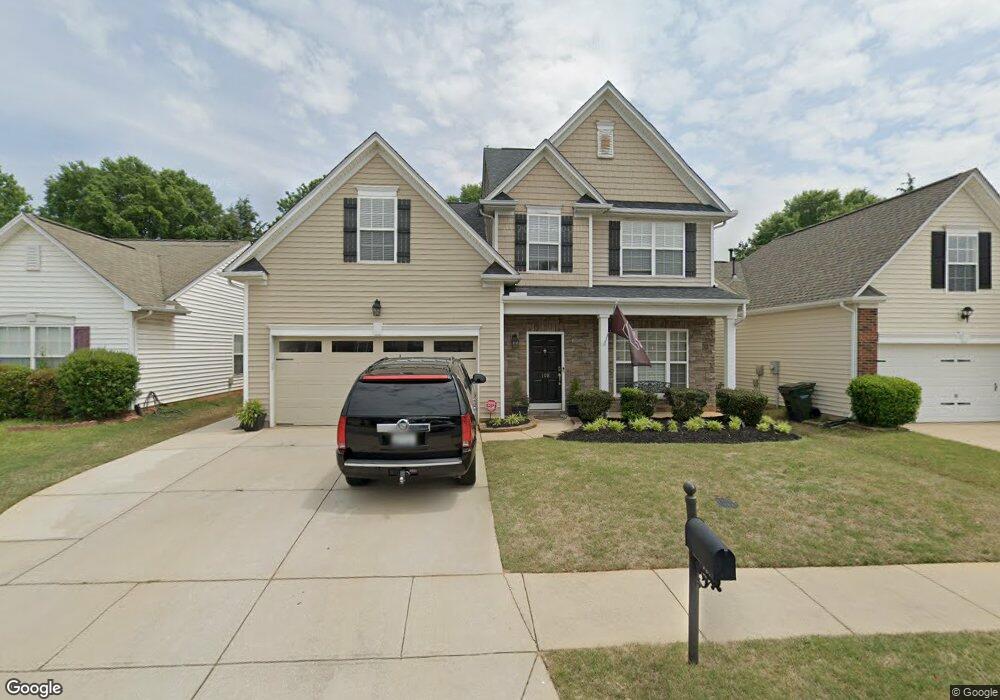
About This Home
This home is located at 108 Tralee Ln, Greer, SC 29650 and is currently estimated at $329,664, approximately $156 per square foot. 108 Tralee Ln is a home located in Greenville County with nearby schools including Brushy Creek Elementary School, Riverside Middle School, and Riverside High School.
Ownership History
Date
Name
Owned For
Owner Type
Purchase Details
Closed on
Jun 14, 2012
Sold by
United States Department Of Housing & Ur
Bought by
Pressley Derek T
Current Estimated Value
Home Financials for this Owner
Home Financials are based on the most recent Mortgage that was taken out on this home.
Original Mortgage
$132,519
Outstanding Balance
$90,702
Interest Rate
3.87%
Mortgage Type
FHA
Estimated Equity
$238,962
Purchase Details
Closed on
Nov 21, 2011
Sold by
Mcalister Ricky D and Mcalister Laurie M
Bought by
Secretary Of Housing & Urban Development
Purchase Details
Closed on
Feb 19, 2008
Sold by
Eastwood Construction Co Inc
Bought by
Mcalister Ricky D and Mcalister Laurie M
Home Financials for this Owner
Home Financials are based on the most recent Mortgage that was taken out on this home.
Original Mortgage
$185,948
Interest Rate
5.85%
Mortgage Type
Purchase Money Mortgage
Create a Home Valuation Report for This Property
The Home Valuation Report is an in-depth analysis detailing your home's value as well as a comparison with similar homes in the area
Home Values in the Area
Average Home Value in this Area
Purchase History
| Date | Buyer | Sale Price | Title Company |
|---|---|---|---|
| Pressley Derek T | $136,000 | -- | |
| Secretary Of Housing & Urban Development | $125,000 | -- | |
| Mcalister Ricky D | $187,455 | None Available |
Source: Public Records
Mortgage History
| Date | Status | Borrower | Loan Amount |
|---|---|---|---|
| Open | Pressley Derek T | $132,519 | |
| Previous Owner | Mcalister Ricky D | $185,948 |
Source: Public Records
Tax History
| Year | Tax Paid | Tax Assessment Tax Assessment Total Assessment is a certain percentage of the fair market value that is determined by local assessors to be the total taxable value of land and additions on the property. | Land | Improvement |
|---|---|---|---|---|
| 2025 | $2,365 | $9,870 | $2,450 | $7,420 |
| 2024 | $2,365 | $8,580 | $1,300 | $7,280 |
| 2023 | $2,352 | $8,580 | $1,300 | $7,280 |
| 2022 | $2,193 | $8,580 | $1,300 | $7,280 |
| 2021 | $2,137 | $8,580 | $1,300 | $7,280 |
| 2020 | $1,801 | $7,480 | $1,180 | $6,300 |
| 2019 | $1,795 | $7,480 | $1,180 | $6,300 |
| 2018 | $1,786 | $7,480 | $1,180 | $6,300 |
| 2017 | $1,777 | $7,480 | $1,180 | $6,300 |
| 2016 | $1,545 | $165,620 | $25,500 | $140,120 |
| 2015 | $1,505 | $165,620 | $25,500 | $140,120 |
| 2014 | $1,652 | $183,640 | $29,000 | $154,640 |
Source: Public Records
Map
Nearby Homes
- 12 Sabine Leaf Ct
- 34 Swade Way
- 208 Elise Dr
- 6 Kylemore Ln
- 105 Moorlyn Ln
- 320 Sea Isle Place
- 220 Spring Crossing Cir
- 417 Sea Grit Ct
- 145 Spring Crossing Cir
- 76 Riley Eden Ln Unit Site 1
- 68 Riley Eden Ln Unit Site 3
- 213 Kingscreek Dr
- 44 Riley Eden Ln
- 107 Kingscreek Dr
- 100 Grey Oak Trail
- 8 Sunfield Ct
- 133 Fawnbrook Dr
- 221 Courtyard Ct
- 241 Courtyard Ct
- 519 Longview Terrace
- 110 Tralee Ln
- 106 Tralee Ln
- 112 Tralee Ln
- 104 Tralee Ln
- 114 Tralee Ln
- 107 Tralee Ln
- 109 Tralee Ln
- 105 Tralee Ln
- 111 Tralee Ln
- 103 Tralee Ln
- 8 Sabine Leaf Ct Unit 52
- 8 Sabine Leaf Ct
- 116 Tralee Ln
- 6 Sabine Leaf Ct Unit 53
- 6 Sabine Leaf Ct
- 12 Sabine Leaf Ct Unit 50
- 10 Sabine Leaf Ct Unit 51
- 10 Sabine Leaf Ct
- 100 Tralee Ln
- 4 Sabine Leaf Ct Unit 54
Your Personal Tour Guide
Ask me questions while you tour the home.