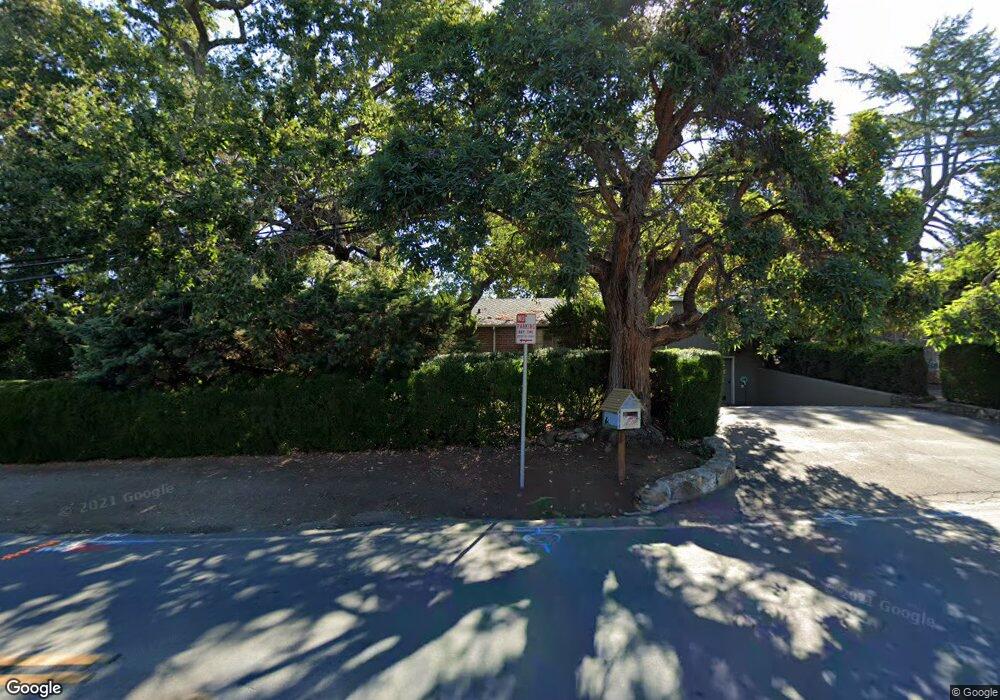
10810 Mora Dr Los Altos, CA 94024
Estimated Value: $4,835,000 - $5,115,000
4
Beds
4
Baths
2,870
Sq Ft
$1,749/Sq Ft
Est. Value
About This Home
This home is located at 10810 Mora Dr, Los Altos, CA 94024 and is currently estimated at $5,020,341, approximately $1,749 per square foot. 10810 Mora Dr is a home located in Santa Clara County with nearby schools including Loyola Elementary School, Georgina P. Blach Junior High School, and Mountain View High School.
Ownership History
Date
Name
Owned For
Owner Type
Purchase Details
Closed on
Nov 8, 2010
Sold by
Wymelenberg Joseph B Vanden
Bought by
Wymelenberg Joseph B Vanden
Current Estimated Value
Home Financials for this Owner
Home Financials are based on the most recent Mortgage that was taken out on this home.
Original Mortgage
$177,000
Outstanding Balance
$141,839
Interest Rate
4.17%
Mortgage Type
Future Advance Clause Open End Mortgage
Estimated Equity
$4,878,502
Purchase Details
Closed on
Dec 27, 2000
Sold by
Hughes Richard W And Larraine M Trustee
Bought by
Vandenwymelenberg Joseph B
Home Financials for this Owner
Home Financials are based on the most recent Mortgage that was taken out on this home.
Original Mortgage
$1,560,000
Outstanding Balance
$589,349
Interest Rate
7.87%
Estimated Equity
$4,430,992
Create a Home Valuation Report for This Property
The Home Valuation Report is an in-depth analysis detailing your home's value as well as a comparison with similar homes in the area
Home Values in the Area
Average Home Value in this Area
Purchase History
| Date | Buyer | Sale Price | Title Company |
|---|---|---|---|
| Wymelenberg Joseph B Vanden | -- | Old Republic Title Company | |
| Wymelenberg Joseph B Vanden | -- | Old Republic Title Co-Pa | |
| Vandenwymelenberg Joseph B | $2,400,000 | First American Title Guarant |
Source: Public Records
Mortgage History
| Date | Status | Borrower | Loan Amount |
|---|---|---|---|
| Open | Wymelenberg Joseph B Vanden | $177,000 | |
| Closed | Wymelenberg Joseph B Vanden | $177,000 | |
| Open | Wymelenberg Joseph B Vanden | $729,750 | |
| Closed | Wymelenberg Joseph B Vanden | $729,750 | |
| Open | Vandenwymelenberg Joseph B | $1,560,000 | |
| Closed | Vandenwymelenberg Joseph B | $200,000 |
Source: Public Records
Tax History Compared to Growth
Tax History
| Year | Tax Paid | Tax Assessment Tax Assessment Total Assessment is a certain percentage of the fair market value that is determined by local assessors to be the total taxable value of land and additions on the property. | Land | Improvement |
|---|---|---|---|---|
| 2025 | $41,421 | $3,694,969 | $3,013,698 | $681,271 |
| 2024 | $41,421 | $3,555,427 | $2,954,606 | $600,821 |
| 2023 | $36,372 | $3,091,471 | $2,896,673 | $194,798 |
| 2022 | $35,703 | $2,997,868 | $2,839,876 | $157,992 |
| 2021 | $40,680 | $3,341,025 | $2,784,193 | $556,832 |
| 2020 | $41,012 | $3,306,768 | $2,755,645 | $551,123 |
| 2019 | $38,994 | $3,241,930 | $2,701,613 | $540,317 |
| 2018 | $35,411 | $2,911,900 | $2,426,500 | $485,400 |
| 2017 | $32,633 | $2,733,000 | $2,277,500 | $455,500 |
| 2016 | $32,105 | $2,700,000 | $2,250,000 | $450,000 |
| 2015 | $32,249 | $2,714,000 | $2,261,600 | $452,400 |
| 2014 | $28,382 | $2,360,000 | $1,966,700 | $393,300 |
Source: Public Records
Map
Nearby Homes
- 11027 Eastbrook Ave
- 23171 Mora Glen Dr
- 23525 Ravensbury Ave
- 11569 Arroyo Oaks Dr
- 730 Mora Dr
- 857 Hierra Ct
- 11722 Putter Way
- 1627 Shirley Ave
- 1613 Shirley Ave
- 10495 Albertsworth Ln
- 11664 Winding Way
- 1571 Fairway Dr
- 1365-B Fairway Dr
- 932 Lundy Ln
- 980-B Lundy Ln
- 11981 Magdalena Ave
- 2261 Via Maderos
- 5824 Arboretum Dr
- 1992 Deodara Dr
- 28120 Laura Ct