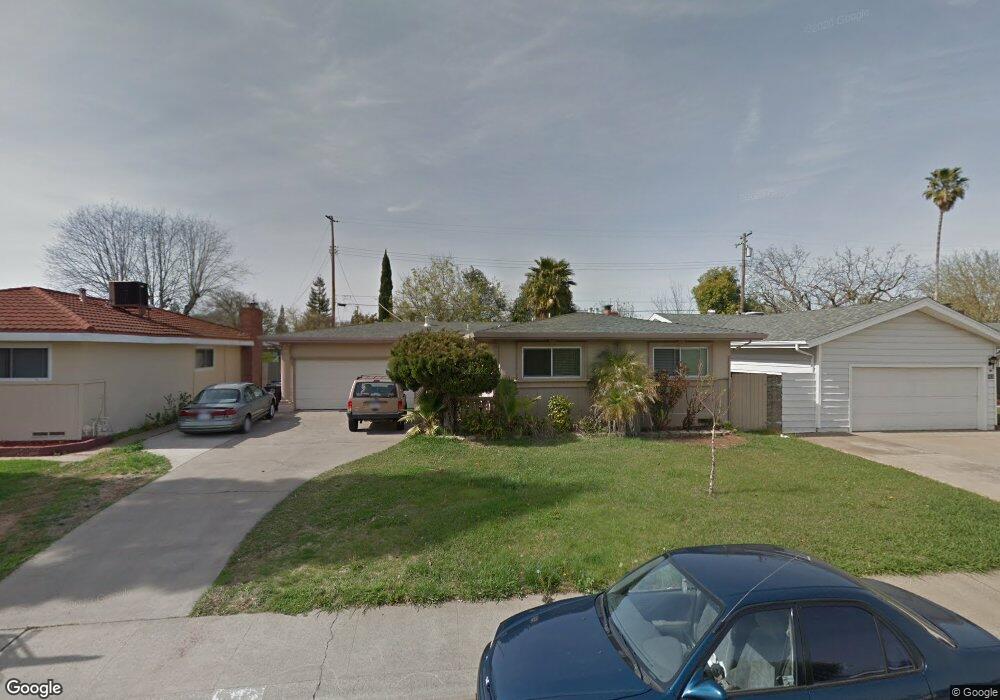
10825 Scotsman Way Rancho Cordova, CA 95670
Cordova Lane NeighborhoodEstimated Value: $286,000 - $456,000
3
Beds
2
Baths
1,205
Sq Ft
$330/Sq Ft
Est. Value
About This Home
This home is located at 10825 Scotsman Way, Rancho Cordova, CA 95670 and is currently estimated at $397,484, approximately $329 per square foot. 10825 Scotsman Way is a home located in Sacramento County with nearby schools including Rancho Cordova Elementary School, W.E. Mitchell Middle School, and Cordova High School.
Ownership History
Date
Name
Owned For
Owner Type
Purchase Details
Closed on
Mar 14, 2007
Sold by
Cruz Jorge
Bought by
Lloyd Glenda O and Lyons Sandra J
Current Estimated Value
Home Financials for this Owner
Home Financials are based on the most recent Mortgage that was taken out on this home.
Original Mortgage
$75,000
Outstanding Balance
$45,521
Interest Rate
6.31%
Mortgage Type
Purchase Money Mortgage
Estimated Equity
$351,963
Purchase Details
Closed on
Mar 9, 2005
Sold by
Kondrashevich Anatoliy and Kondrashevich Nadezhda
Bought by
Cruz Jorge
Home Financials for this Owner
Home Financials are based on the most recent Mortgage that was taken out on this home.
Original Mortgage
$255,200
Interest Rate
6.89%
Mortgage Type
Purchase Money Mortgage
Purchase Details
Closed on
May 23, 2001
Sold by
Hancock Edwin M and Hancock Kim Y
Bought by
Kondrashevich Anatoliy and Kondrashevich Nadezhda
Home Financials for this Owner
Home Financials are based on the most recent Mortgage that was taken out on this home.
Original Mortgage
$126,000
Interest Rate
7.15%
Create a Home Valuation Report for This Property
The Home Valuation Report is an in-depth analysis detailing your home's value as well as a comparison with similar homes in the area
Home Values in the Area
Average Home Value in this Area
Purchase History
| Date | Buyer | Sale Price | Title Company |
|---|---|---|---|
| Lloyd Glenda O | $250,000 | Financial Title Company | |
| Cruz Jorge | $319,000 | Chicago Title Co | |
| Kondrashevich Anatoliy | $140,000 | Stewart Title |
Source: Public Records
Mortgage History
| Date | Status | Borrower | Loan Amount |
|---|---|---|---|
| Open | Lloyd Glenda O | $75,000 | |
| Previous Owner | Cruz Jorge | $255,200 | |
| Previous Owner | Kondrashevich Anatoliy | $126,000 | |
| Closed | Cruz Jorge | $63,800 |
Source: Public Records
Tax History Compared to Growth
Tax History
| Year | Tax Paid | Tax Assessment Tax Assessment Total Assessment is a certain percentage of the fair market value that is determined by local assessors to be the total taxable value of land and additions on the property. | Land | Improvement |
|---|---|---|---|---|
| 2025 | $5,167 | $334,929 | $160,764 | $174,165 |
| 2024 | $5,167 | $328,362 | $157,612 | $170,750 |
| 2023 | $5,090 | $321,924 | $154,522 | $167,402 |
| 2022 | $5,031 | $315,613 | $151,493 | $164,120 |
| 2021 | $4,957 | $309,425 | $148,523 | $160,902 |
| 2020 | $4,933 | $306,254 | $147,001 | $159,253 |
| 2019 | $4,711 | $286,541 | $137,538 | $149,003 |
| 2018 | $4,559 | $275,522 | $132,249 | $143,273 |
| 2017 | $2,914 | $248,219 | $119,144 | $129,075 |
| 2016 | $2,585 | $219,664 | $105,438 | $114,226 |
| 2015 | $2,261 | $199,695 | $95,853 | $103,842 |
| 2014 | $2,314 | $188,391 | $90,427 | $97,964 |
Source: Public Records
Map
Nearby Homes
- 10825 Walnutwood Way
- 2404 Coolidge Way
- 2701 Zinfandel Dr
- 2413 Cordova Ln
- 2352 Sonata Dr
- 2337 Benita Dr
- 2329 Mcgregor Dr
- 2256 Ramo Ct
- 2255 El Manto Dr
- 10583 Home Ranch Ct
- 2746 Aramon Dr
- 2724 Zinfandel Dr
- 10810 Paiute Way
- 10732 Paiute Way
- 10835 Coloma Rd Unit 3
- 1977 Benita Dr Unit 1
- 2200 Kimwood Ln
- 10465 Rugby Ct
- 3054 Banano Way
- 1920 Benita Dr
- 10829 Scotsman Way
- 10821 Scotsman Way
- 10820 Alandale Way
- 10833 Scotsman Way
- 10816 Alandale Way
- 10824 Alandale Way
- 10824 Scotsman Way
- 10828 Scotsman Way
- 10820 Scotsman Way
- 10828 Alandale Way
- 10837 Scotsman Way
- 10804 Scotsman Way
- 10832 Scotsman Way
- 10808 Scotsman Way
- 10808 Alandale Way
- 10816 Scotsman Way
- 10832 Alandale Way
- 10812 Scotsman Way
- 10841 Scotsman Way
- 10836 Scotsman Way