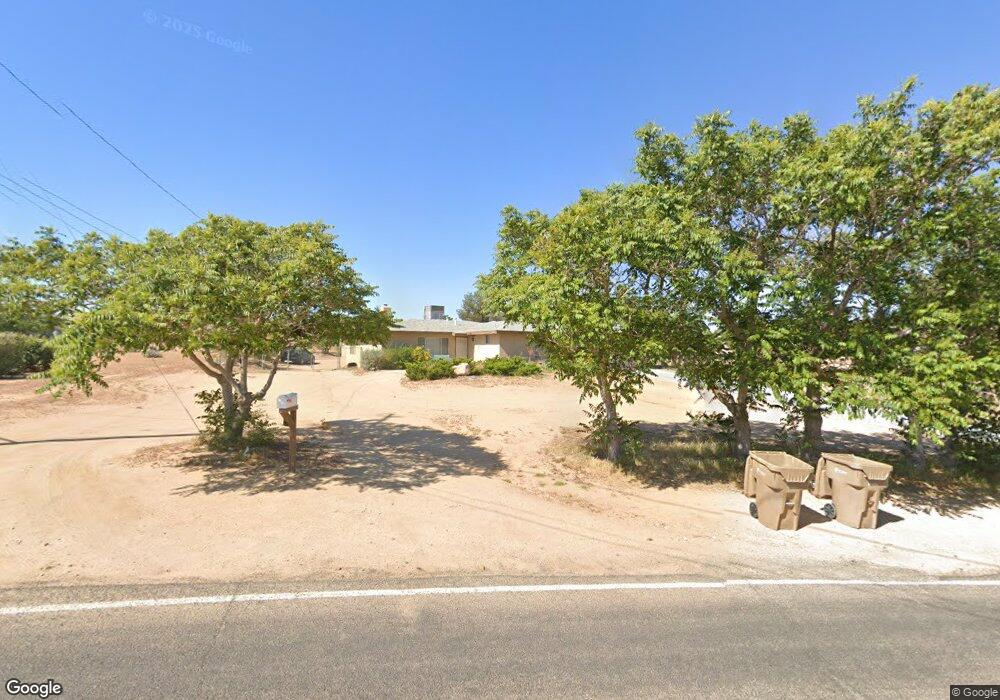
10840 Choiceana Ave Hesperia, CA 92345
Estimated Value: $431,503 - $493,000
3
Beds
2
Baths
1,887
Sq Ft
$249/Sq Ft
Est. Value
About This Home
This home is located at 10840 Choiceana Ave, Hesperia, CA 92345 and is currently estimated at $470,126, approximately $249 per square foot. 10840 Choiceana Ave is a home located in San Bernardino County with nearby schools including Carmel Elementary School, Ranchero Middle School, and Sultana High School.
Ownership History
Date
Name
Owned For
Owner Type
Purchase Details
Closed on
Mar 14, 2013
Sold by
Machseh Llc
Bought by
Bratt David G
Current Estimated Value
Purchase Details
Closed on
Dec 19, 2012
Sold by
Harris Debra L
Bought by
Machseh Llc
Purchase Details
Closed on
Jul 19, 2004
Sold by
Harris Robert D and Harris Debra L
Bought by
Harris Debra L
Home Financials for this Owner
Home Financials are based on the most recent Mortgage that was taken out on this home.
Original Mortgage
$132,500
Interest Rate
6.7%
Mortgage Type
New Conventional
Purchase Details
Closed on
Feb 9, 1999
Sold by
Harris Debra L
Bought by
Harris Robert D and Harris Debra L
Home Financials for this Owner
Home Financials are based on the most recent Mortgage that was taken out on this home.
Original Mortgage
$75,665
Interest Rate
6.77%
Mortgage Type
FHA
Purchase Details
Closed on
Oct 7, 1997
Sold by
Vansant Donald and Vansant Robert D
Bought by
Harris Debra L
Create a Home Valuation Report for This Property
The Home Valuation Report is an in-depth analysis detailing your home's value as well as a comparison with similar homes in the area
Home Values in the Area
Average Home Value in this Area
Purchase History
| Date | Buyer | Sale Price | Title Company |
|---|---|---|---|
| Bratt David G | $155,000 | Title 365 | |
| Bratt David G | -- | Title 365 | |
| Machseh Llc | $97,000 | Accommodation | |
| Harris Debra L | -- | New Century Title Company | |
| Harris Robert D | -- | Universal Title Company | |
| Harris Debra L | -- | -- |
Source: Public Records
Mortgage History
| Date | Status | Borrower | Loan Amount |
|---|---|---|---|
| Previous Owner | Harris Debra L | $132,500 | |
| Previous Owner | Harris Robert D | $75,665 |
Source: Public Records
Tax History Compared to Growth
Tax History
| Year | Tax Paid | Tax Assessment Tax Assessment Total Assessment is a certain percentage of the fair market value that is determined by local assessors to be the total taxable value of land and additions on the property. | Land | Improvement |
|---|---|---|---|---|
| 2025 | $1,940 | $176,095 | $24,628 | $151,467 |
| 2024 | $1,940 | $172,642 | $24,145 | $148,497 |
| 2023 | $1,847 | $169,257 | $23,672 | $145,585 |
| 2022 | $1,804 | $165,938 | $23,208 | $142,730 |
| 2021 | $1,770 | $162,684 | $22,753 | $139,931 |
| 2020 | $1,749 | $161,016 | $22,520 | $138,496 |
| 2019 | $1,712 | $157,858 | $22,078 | $135,780 |
| 2018 | $1,678 | $154,763 | $21,645 | $133,118 |
| 2017 | $1,648 | $151,729 | $21,221 | $130,508 |
| 2016 | $1,612 | $148,754 | $20,805 | $127,949 |
| 2015 | $1,591 | $146,519 | $20,492 | $126,027 |
| 2014 | $1,568 | $143,649 | $20,091 | $123,558 |
Source: Public Records
Map
Nearby Homes
- 18635 Verano St
- 10765 Choiceana Ave
- 18785 Talisman St
- 10656 Choiceana Ave
- 18441 Verano St
- 18476 Talisman St
- 18333 Talisman St
- 18238 Talisman St
- 18135 Valencia St
- 11444 River Run St
- 11156 Camden St
- 0 Jacaranda Unit CV24240940
- 18707 Hercules St
- 0 Choiceana Ave Unit IV25199738
- 0 Choiceana Ave Unit HD25180587
- 19255 Castana St
- 10858 Katepwa St
- 10852 Katepwa St
- 19369 Glaslyn Ct
- 10887 Katepwa St
- 18677 Lemert St
- 18708 Valencia St
- 18700 Valencia St
- 10867 Choiceana Ave
- 10835 Choiceana Ave
- 18659 Lemert St
- 18680 Valencia St
- 10895 Choiceana Ave
- 18635 Lemert St
- 18723 Valencia St
- 18661 Valencia St
- 18658 Valencia St
- 18750 Valencia St
- 18739 Valencia St
- 10878 Choiceana Ave
- 18721 Valencia St
- 18659 Verano St
- 0 Lemert St
- 18624 Lemert St
- 18632 Valencia St