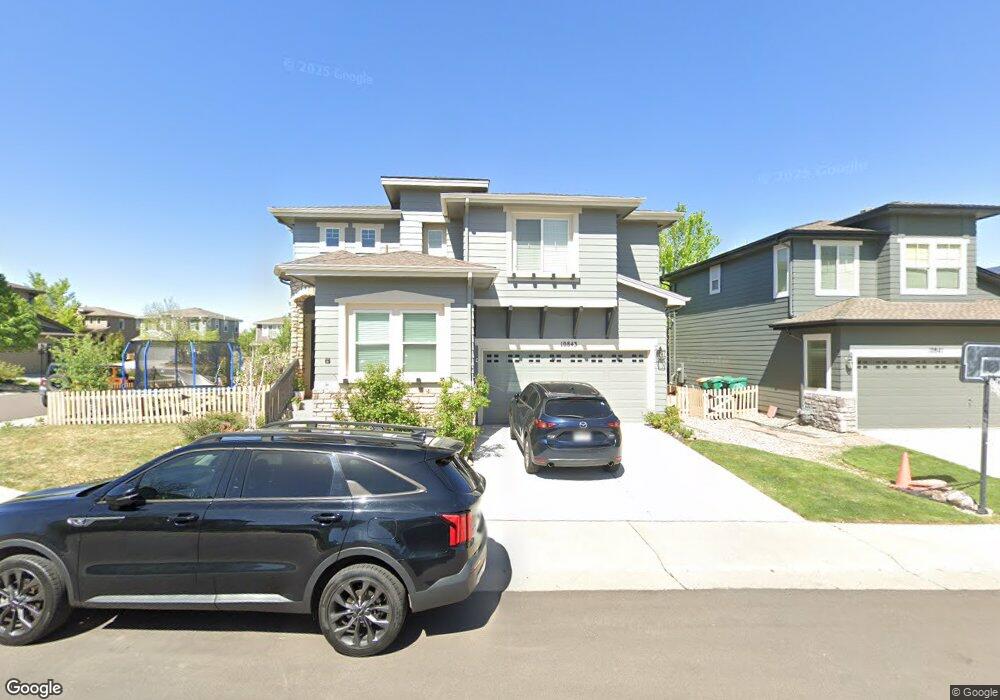
10843 Towerbridge Ln Highlands Ranch, CO 80130
Southridge NeighborhoodEstimated Value: $631,000 - $646,000
2
Beds
3
Baths
1,744
Sq Ft
$366/Sq Ft
Est. Value
About This Home
This home is located at 10843 Towerbridge Ln, Highlands Ranch, CO 80130 and is currently estimated at $637,509, approximately $365 per square foot. 10843 Towerbridge Ln is a home located in Douglas County with nearby schools including Wildcat Mountain Elementary School, Rocky Heights Middle School, and Rock Canyon High School.
Ownership History
Date
Name
Owned For
Owner Type
Purchase Details
Closed on
Dec 26, 2019
Sold by
Mason Mowery Jennifer K
Bought by
Mason Mowery Jennifer K and Mason Janet M
Current Estimated Value
Home Financials for this Owner
Home Financials are based on the most recent Mortgage that was taken out on this home.
Original Mortgage
$378,510
Outstanding Balance
$333,779
Interest Rate
3.5%
Mortgage Type
FHA
Estimated Equity
$303,730
Purchase Details
Closed on
Apr 3, 2015
Sold by
Mason Jennifer K
Bought by
Mason Mowery Jennifer K
Purchase Details
Closed on
Jun 21, 2005
Sold by
Shea Homes Lp
Bought by
Mason Jennifer K
Home Financials for this Owner
Home Financials are based on the most recent Mortgage that was taken out on this home.
Original Mortgage
$225,365
Interest Rate
5.61%
Mortgage Type
Fannie Mae Freddie Mac
Create a Home Valuation Report for This Property
The Home Valuation Report is an in-depth analysis detailing your home's value as well as a comparison with similar homes in the area
Home Values in the Area
Average Home Value in this Area
Purchase History
| Date | Buyer | Sale Price | Title Company |
|---|---|---|---|
| Mason Mowery Jennifer K | -- | First Integrity Title | |
| Mason Mowery Jennifer K | -- | None Available | |
| Mason Jennifer K | $281,707 | -- |
Source: Public Records
Mortgage History
| Date | Status | Borrower | Loan Amount |
|---|---|---|---|
| Open | Mason Mowery Jennifer K | $378,510 | |
| Closed | Mason Jennifer K | $225,365 |
Source: Public Records
Tax History Compared to Growth
Tax History
| Year | Tax Paid | Tax Assessment Tax Assessment Total Assessment is a certain percentage of the fair market value that is determined by local assessors to be the total taxable value of land and additions on the property. | Land | Improvement |
|---|---|---|---|---|
| 2024 | $3,904 | $45,100 | $10,350 | $34,750 |
| 2023 | $3,897 | $45,100 | $10,350 | $34,750 |
| 2022 | $2,940 | $32,180 | $7,600 | $24,580 |
| 2021 | $3,058 | $32,180 | $7,600 | $24,580 |
| 2020 | $2,870 | $30,950 | $6,730 | $24,220 |
| 2019 | $2,881 | $30,950 | $6,730 | $24,220 |
| 2018 | $2,604 | $27,550 | $6,150 | $21,400 |
| 2017 | $2,371 | $27,550 | $6,150 | $21,400 |
| 2016 | $2,288 | $26,100 | $5,540 | $20,560 |
| 2015 | $2,338 | $26,100 | $5,540 | $20,560 |
| 2014 | $1,066 | $21,970 | $6,930 | $15,040 |
Source: Public Records
Map
Nearby Homes
- 10754 Towerbridge Cir
- 10660 Jewelberry Cir
- 5300 Fullerton Ln
- 6042 Sima Cir
- 10645 Cedarcrest Cir
- 4965 Huntwick Place
- 10557 Eby Cir
- 11036 Glengate Cir
- 5639 Jaguar Way
- 10557 Jaguar Dr
- 4821 Bluegate Dr
- 10722 Cougar Canyon
- 11041 Puma Run
- 10445 Cheetah Winds
- 10881 Glengate Cir
- 10439 Cheetah Winds
- 11074 Grayledge Cir
- 10547 Laurelglen Cir
- 5632 Tory Pointe
- 4656 Ketchwood Cir
- 10883 Towerbridge Ln
- 10841 Towerbridge Ln
- 10850 Brooklawn Rd
- 10846 Brooklawn Rd
- 10833 Towerbridge Ln
- 10842 Towerbridge Ln
- 10842 Brooklawn Rd
- 10840 Towerbridge Ln
- 10856 Towerbridge Ln
- 10864 Towerbridge Ln
- 10848 Towerbridge Ln
- 10834 Towerbridge Ln
- 10870 Towerbridge Ln
- 10827 Towerbridge Ln
- 10854 Towerbridge Ln
- 10830 Towerbridge Ln
- 10838 Brooklawn Rd
- 10851 Brooklawn Rd
- 10847 Brooklawn Rd
- 10872 Brooklawn Rd