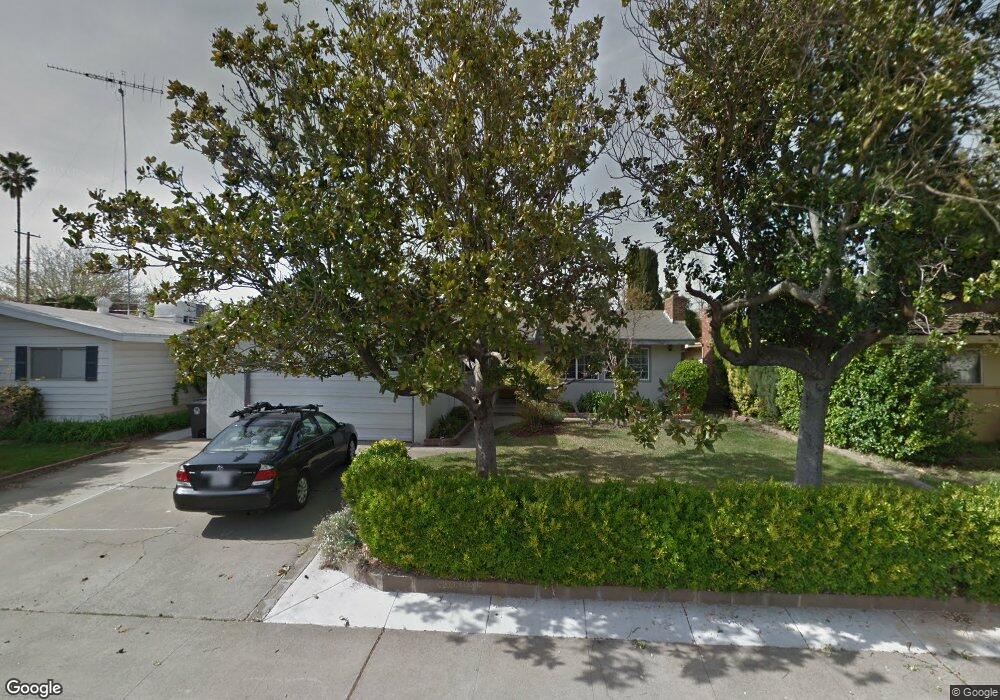
10849 Scotsman Way Rancho Cordova, CA 95670
Cordova Lane NeighborhoodEstimated Value: $453,000 - $471,000
3
Beds
2
Baths
1,761
Sq Ft
$263/Sq Ft
Est. Value
About This Home
This home is located at 10849 Scotsman Way, Rancho Cordova, CA 95670 and is currently estimated at $463,332, approximately $263 per square foot. 10849 Scotsman Way is a home located in Sacramento County with nearby schools including Rancho Cordova Elementary School, W.E. Mitchell Middle School, and Cordova High School.
Ownership History
Date
Name
Owned For
Owner Type
Purchase Details
Closed on
Dec 1, 2020
Sold by
Baptist Leon J and Baptist Katie A
Bought by
Baptist Leon J and Baptist Katie A
Current Estimated Value
Purchase Details
Closed on
Mar 11, 2002
Sold by
Welton Robert L and Loeffler Welton Lise M
Bought by
Baptist Leon J and Baptist Katie A
Home Financials for this Owner
Home Financials are based on the most recent Mortgage that was taken out on this home.
Original Mortgage
$129,350
Outstanding Balance
$53,767
Interest Rate
6.99%
Estimated Equity
$409,565
Purchase Details
Closed on
Jul 28, 1998
Sold by
Taylor Sherry L and Taylor Cindy A
Bought by
Welton Robert L and Loeffler Welton Lise M
Home Financials for this Owner
Home Financials are based on the most recent Mortgage that was taken out on this home.
Original Mortgage
$110,650
Interest Rate
6.9%
Create a Home Valuation Report for This Property
The Home Valuation Report is an in-depth analysis detailing your home's value as well as a comparison with similar homes in the area
Home Values in the Area
Average Home Value in this Area
Purchase History
| Date | Buyer | Sale Price | Title Company |
|---|---|---|---|
| Baptist Leon J | -- | None Available | |
| Baptist Leon J | $172,500 | North American Title Co | |
| Welton Robert L | $116,500 | Financial Title Company |
Source: Public Records
Mortgage History
| Date | Status | Borrower | Loan Amount |
|---|---|---|---|
| Open | Baptist Leon J | $129,350 | |
| Previous Owner | Welton Robert L | $110,650 | |
| Closed | Baptist Leon J | $30,500 |
Source: Public Records
Tax History Compared to Growth
Tax History
| Year | Tax Paid | Tax Assessment Tax Assessment Total Assessment is a certain percentage of the fair market value that is determined by local assessors to be the total taxable value of land and additions on the property. | Land | Improvement |
|---|---|---|---|---|
| 2025 | $1,298 | $254,810 | $66,466 | $188,344 |
| 2024 | $1,298 | $102,079 | $65,163 | $36,916 |
| 2023 | $2,959 | $244,917 | $63,886 | $181,031 |
| 2022 | $2,921 | $240,116 | $62,634 | $177,482 |
| 2021 | $2,865 | $235,408 | $61,406 | $174,002 |
| 2020 | $2,846 | $232,995 | $60,777 | $172,218 |
| 2019 | $2,718 | $228,428 | $59,586 | $168,842 |
| 2018 | $2,647 | $223,950 | $58,418 | $165,532 |
| 2017 | $2,578 | $219,560 | $57,273 | $162,287 |
| 2016 | $2,533 | $215,255 | $56,150 | $159,105 |
| 2015 | $2,403 | $212,023 | $55,307 | $156,716 |
| 2014 | $2,462 | $200,203 | $52,225 | $147,978 |
Source: Public Records
Map
Nearby Homes
- 10825 Walnutwood Way
- 2404 Coolidge Way
- 2701 Zinfandel Dr
- 2413 Cordova Ln
- 2352 Sonata Dr
- 2337 Benita Dr
- 2329 Mcgregor Dr
- 2256 Ramo Ct
- 2255 El Manto Dr
- 2724 Zinfandel Dr
- 10810 Paiute Way
- 10583 Home Ranch Ct
- 2746 Aramon Dr
- 10835 Coloma Rd Unit 3
- 10732 Paiute Way
- 2200 Kimwood Ln
- 1977 Benita Dr Unit 1
- 3054 Banano Way
- 311 Sunny Hills Dr
- 1920 Benita Dr
- 10845 Scotsman Way
- 10853 Scotsman Way
- 10841 Scotsman Way
- 10840 Alandale Way
- 10857 Scotsman Way
- 10844 Alandale Way
- 10836 Alandale Way
- 10848 Scotsman Way
- 10848 Alandale Way
- 10844 Scotsman Way
- 10852 Scotsman Way
- 10837 Scotsman Way
- 10861 Scotsman Way
- 10832 Alandale Way
- 10840 Scotsman Way
- 10856 Scotsman Way
- 10852 Alandale Way
- 10833 Scotsman Way
- 10836 Scotsman Way
- 10860 Scotsman Way