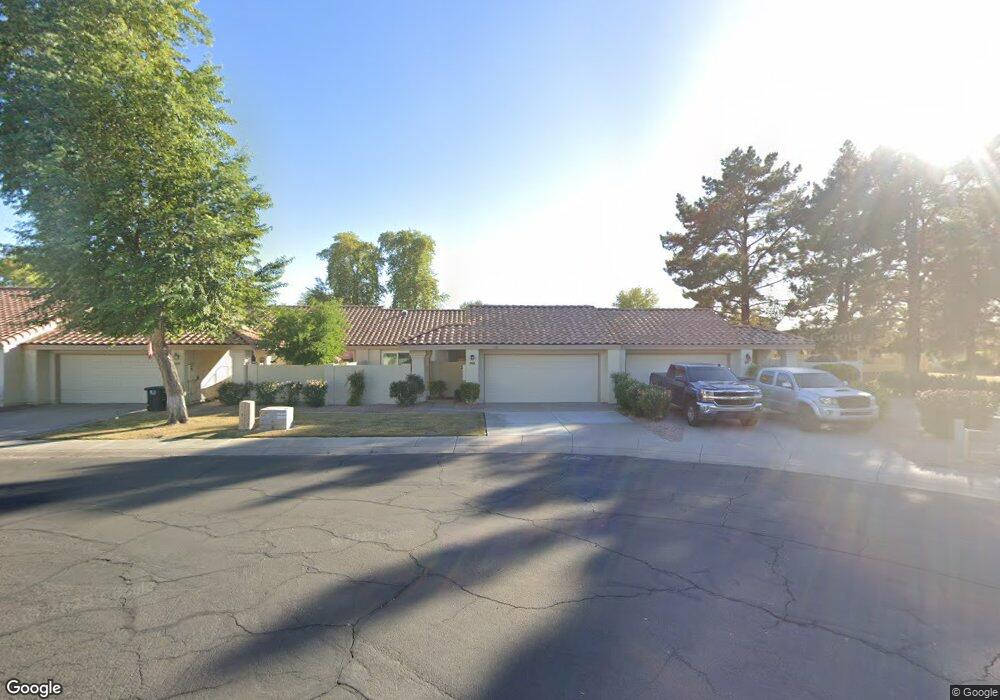
1085 E Chilton Dr Tempe, AZ 85283
South Tempe NeighborhoodEstimated Value: $395,878 - $434,000
Studio
2
Baths
1,303
Sq Ft
$318/Sq Ft
Est. Value
About This Home
This home is located at 1085 E Chilton Dr, Tempe, AZ 85283 and is currently estimated at $414,970, approximately $318 per square foot. 1085 E Chilton Dr is a home located in Maricopa County with nearby schools including Kyrene de los Niños Elementary School, Kyrene del Norte School, and Kyrene Middle School.
Ownership History
Date
Name
Owned For
Owner Type
Purchase Details
Closed on
Jul 15, 2014
Sold by
Westerlund John S and Westerlund Gail R
Bought by
The Westerlund Family Revocable Trust
Current Estimated Value
Purchase Details
Closed on
Nov 21, 2007
Sold by
Casey James C and Croyle Donna M
Bought by
Westerlund John S and Westerlund Gail R
Home Financials for this Owner
Home Financials are based on the most recent Mortgage that was taken out on this home.
Original Mortgage
$201,600
Outstanding Balance
$127,422
Interest Rate
6.36%
Mortgage Type
New Conventional
Estimated Equity
$287,548
Purchase Details
Closed on
Oct 10, 2002
Sold by
Tappe Clifford E and Tappe Maebelle G
Bought by
Casey James C and Casey Maymie P
Purchase Details
Closed on
Sep 4, 2002
Sold by
Croyle Danny R
Bought by
Croyle Donna M
Create a Home Valuation Report for This Property
The Home Valuation Report is an in-depth analysis detailing your home's value as well as a comparison with similar homes in the area
Home Values in the Area
Average Home Value in this Area
Purchase History
| Date | Buyer | Sale Price | Title Company |
|---|---|---|---|
| The Westerlund Family Revocable Trust | -- | None Available | |
| Westerlund John S | $252,000 | Stewart Title & Trust Of Pho | |
| Casey James C | $155,000 | Capital Title Agency Inc | |
| Croyle Donna M | -- | Capital Title Agency Inc |
Source: Public Records
Mortgage History
| Date | Status | Borrower | Loan Amount |
|---|---|---|---|
| Open | Westerlund John S | $201,600 |
Source: Public Records
Tax History
| Year | Tax Paid | Tax Assessment Tax Assessment Total Assessment is a certain percentage of the fair market value that is determined by local assessors to be the total taxable value of land and additions on the property. | Land | Improvement |
|---|---|---|---|---|
| 2025 | $2,241 | $23,979 | -- | -- |
| 2024 | $2,113 | $22,837 | -- | -- |
| 2023 | $2,113 | $32,300 | $6,460 | $25,840 |
| 2022 | $2,003 | $25,750 | $5,150 | $20,600 |
| 2021 | $2,081 | $24,580 | $4,910 | $19,670 |
| 2020 | $2,032 | $22,820 | $4,560 | $18,260 |
| 2019 | $1,967 | $21,670 | $4,330 | $17,340 |
| 2018 | $1,901 | $20,020 | $4,000 | $16,020 |
| 2017 | $1,823 | $19,130 | $3,820 | $15,310 |
| 2016 | $1,848 | $18,470 | $3,690 | $14,780 |
| 2015 | $1,707 | $17,400 | $3,480 | $13,920 |
Source: Public Records
Map
Nearby Homes
- 1070 E Sunburst Ln
- 920 E Mcnair Dr
- 7716 S Rita Ln Unit 3
- 1045 E Sunburst Ln
- 1060 E Louis Way Unit 14
- 987 E Divot Dr
- 1231 E Sunburst Ln
- 1315 E Mcnair Dr
- 758 E Sunburst Ln
- 831 E Divot Dr
- 6833 S Jentilly Ln
- 1338 E Sunburst Ln
- 1011 E Redfield Rd
- 1455 E Brentrup Dr
- 563 E Krista Way
- 1032 E Redfield Rd
- 6801 S Palm Dr
- 1033 E Bendix Dr
- 1125 E Lodge Dr
- 6743 S Newberry Rd
- 1091 E Chilton Dr
- 1079 E Chilton Dr
- 1097 E Chilton Dr
- 1086 E Mcnair Dr
- 1092 E Mcnair Dr
- 1080 E Mcnair Dr
- 1098 E Mcnair Dr
- 1074 E Mcnair Dr
- 7381 S Bonarden Ln
- 7378 S Bonarden Ln
- 1068 E Mcnair Dr
- 7377 S Bonarden Ln
- 7374 S Bonarden Ln
- 7373 S Bonarden Ln
- 1048 E Mcnair Dr
- 1042 E Mcnair Dr
- 7370 S Bonarden Ln
- 1056 E Mcnair Dr
- 7369 S Bonarden Ln
- 1062 E Mcnair Dr
Your Personal Tour Guide
Ask me questions while you tour the home.