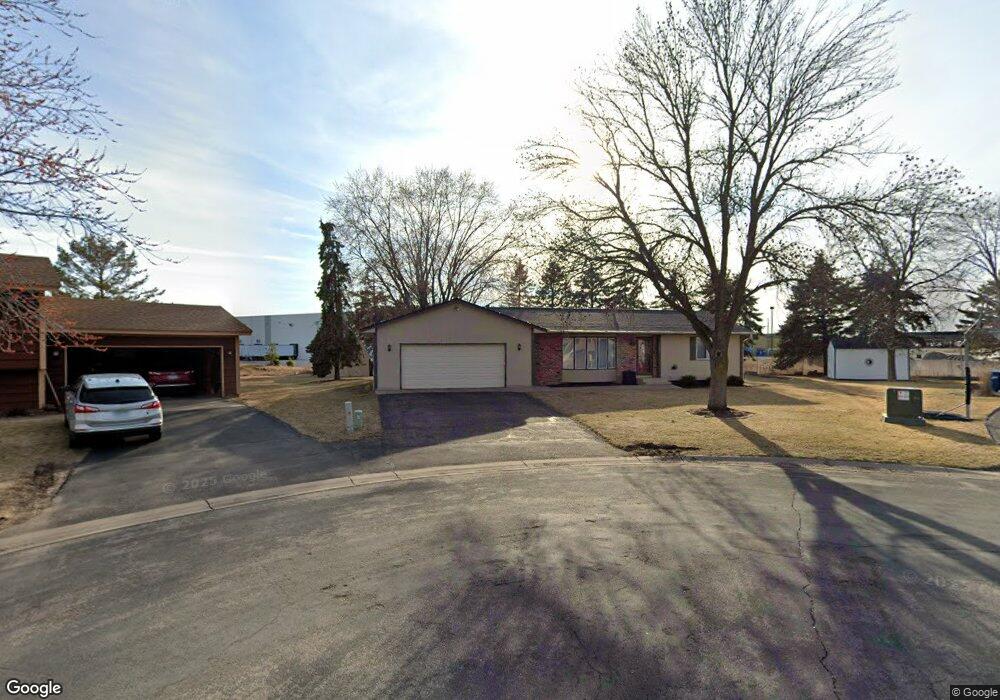
10855 95th Ave N Maple Grove, MN 55369
Estimated Value: $355,000 - $378,419
4
Beds
2
Baths
2,168
Sq Ft
$170/Sq Ft
Est. Value
About This Home
This home is located at 10855 95th Ave N, Maple Grove, MN 55369 and is currently estimated at $367,605, approximately $169 per square foot. 10855 95th Ave N is a home located in Hennepin County with nearby schools including Elm Creek Elementary School, Osseo Middle School, and Osseo Senior High School.
Ownership History
Date
Name
Owned For
Owner Type
Purchase Details
Closed on
Aug 18, 2020
Sold by
Fisher Philip Gerald and Bui Anh Thi
Bought by
Knopick Jake A and Uphoff Carly J
Current Estimated Value
Home Financials for this Owner
Home Financials are based on the most recent Mortgage that was taken out on this home.
Original Mortgage
$288,575
Outstanding Balance
$255,986
Interest Rate
3%
Mortgage Type
New Conventional
Estimated Equity
$111,619
Purchase Details
Closed on
May 12, 2020
Sold by
Fisher Belinda M M
Bought by
Fisher Philip Gerald and Bui Anh Thi
Purchase Details
Closed on
Feb 5, 2014
Sold by
Fisher Philip G
Bought by
Fisher Belinda M M
Home Financials for this Owner
Home Financials are based on the most recent Mortgage that was taken out on this home.
Original Mortgage
$170,000
Interest Rate
4.39%
Mortgage Type
New Conventional
Purchase Details
Closed on
Nov 25, 1997
Sold by
Hess Lisa K
Bought by
Fisher Philip G and Fisher Belinda M M
Create a Home Valuation Report for This Property
The Home Valuation Report is an in-depth analysis detailing your home's value as well as a comparison with similar homes in the area
Home Values in the Area
Average Home Value in this Area
Purchase History
| Date | Buyer | Sale Price | Title Company |
|---|---|---|---|
| Knopick Jake A | $297,500 | Executive Title | |
| Fisher Philip Gerald | $200,000 | None Available | |
| Fisher Belinda M M | -- | None Available | |
| Fisher Philip G | $118,900 | -- |
Source: Public Records
Mortgage History
| Date | Status | Borrower | Loan Amount |
|---|---|---|---|
| Open | Knopick Jake A | $288,575 | |
| Previous Owner | Fisher Belinda M M | $170,000 |
Source: Public Records
Tax History
| Year | Tax Paid | Tax Assessment Tax Assessment Total Assessment is a certain percentage of the fair market value that is determined by local assessors to be the total taxable value of land and additions on the property. | Land | Improvement |
|---|---|---|---|---|
| 2024 | $3,924 | $336,000 | $102,100 | $233,900 |
| 2023 | $3,856 | $334,900 | $96,300 | $238,600 |
| 2022 | $3,296 | $338,200 | $90,000 | $248,200 |
| 2021 | $3,107 | $276,700 | $66,900 | $209,800 |
| 2020 | $3,435 | $256,900 | $50,500 | $206,400 |
| 2019 | $3,413 | $247,000 | $50,500 | $196,500 |
| 2018 | $3,115 | $233,400 | $46,200 | $187,200 |
| 2017 | $3,517 | $194,900 | $46,500 | $148,400 |
| 2016 | $3,536 | $192,100 | $46,500 | $145,600 |
| 2015 | $3,469 | $181,600 | $39,500 | $142,100 |
| 2014 | -- | $166,800 | $34,500 | $132,300 |
Source: Public Records
Map
Nearby Homes
- 10546 Weston Way N
- 9614 Wellington Ln N
- 9858 93rd Place N
- 10405 99th Place N
- 9803 93rd Place N
- 10063 99th Place N
- 615 1st Ave NW
- 8864 Cottonwood Ln N
- 10156 Pilgrim Ln N
- 10186 Quaker Ln N
- 9323 Magnolia Ln N
- 10729 103rd Place N
- 408 1st Ave NE
- 616 2nd Ave NE
- 11781 88th Ave N
- 8936 Norwood Ln N
- 12137 88th Place N
- 12443 90th Ave N
- 8701 Goldenrod Ln N
- 416 3rd Ave NE
- 10845 95th Ave N
- 10858 95th Ave N
- 10825 95th Ave N
- 10848 95th Ave N
- 9481 Wellington Ln N
- 10828 95th Ave N
- 10847 95th Place N
- 9463 Wellington Ln N
- 10857 95th Place N
- 9492 Wellington Ln N
- 10827 95th Place N
- 9502 Wellington Ln N
- 9512 Wellington Ln N
- 9522 Wellington Ln N
- 9451 Wellington Ln N
- 10854 95th Place N
- 9532 Wellington Ln N
- 9433 Wellington Ln N
- 10844 95th Place N
- 10824 95th Place N
Your Personal Tour Guide
Ask me questions while you tour the home.